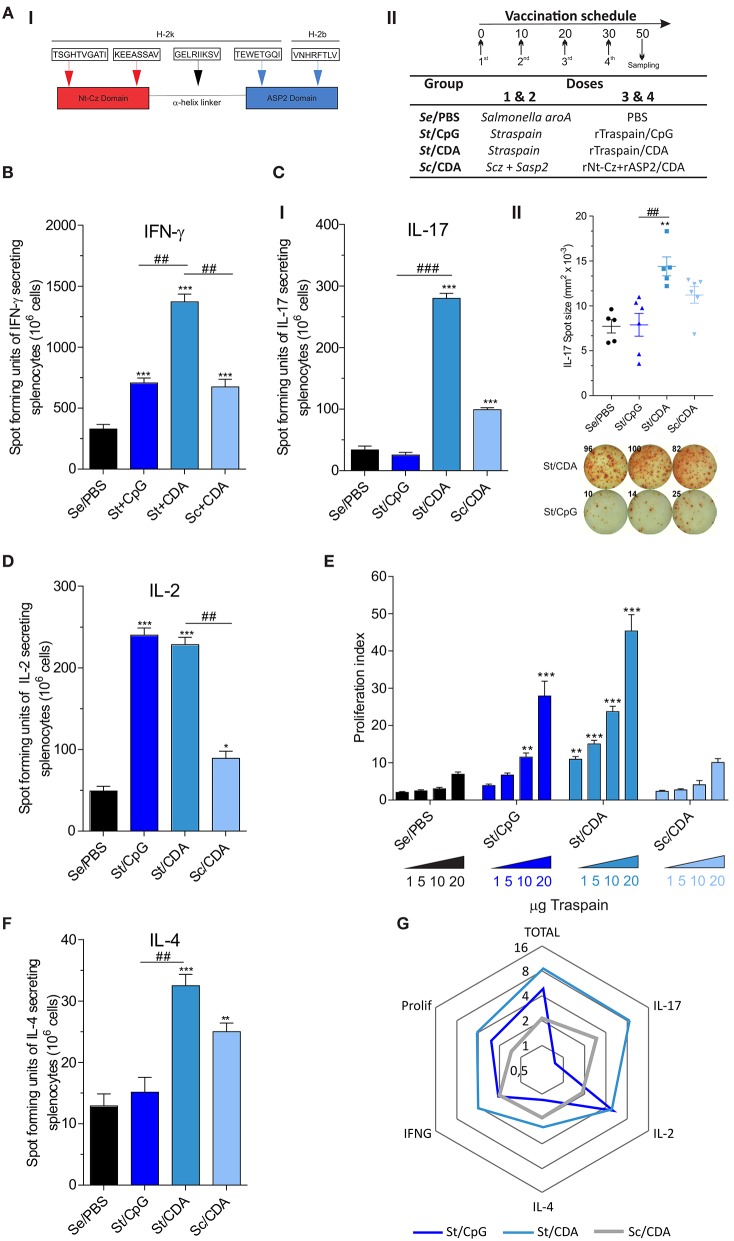
Figure 1.
Profile of the immune response triggered by different prime-boost vaccination protocols. (A) I—Traspain cartoon showing main domains of the molecule and selected murine MHC-I epitopes that have been shown immunogenic. II—Immunization schedule and vaccine formulation received by each group. Secreted cytokines were determined by ELISPOT assay. Pooled-splenocytes were restimulated with RPMI or Traspain, and mean number of spot-forming units were determined for the indicated cytokine: (B) IFN-γ (C) I—IL-17, II—IL-17 spot size and representative image showing the response of spleen cell from mice that received Traspain plus CpG or CDA as an adjuvant. (D) IL-2 and (F) IL-4. *p < 0.05, **p < 0.01, ***p < 0.001 against control group (Se/PBS). ##p < 0.01, ###p < 0.001 between the indicated groups, one-way ANOVA + Tukey's multiple comparisons test. (E) Dose-response curve of antigen-specific proliferation assay. Two-way ANOVA + Dunnett's multiple comparisons test. **p < 0.01, ***p < 0.001 against the corresponding category from control group (Se/PBS). Results are expressed as Mean ± SEM, n = 18 from 6 female C3H mice per group. (G) Radial graph showing average fold of change level of each response variable (cytokines, proliferation, and total response as a sum vs. Se/PBS control group) obtained by each vaccine formulation. Logarithmic scale base 2. All results are representative of two independent experiments.

