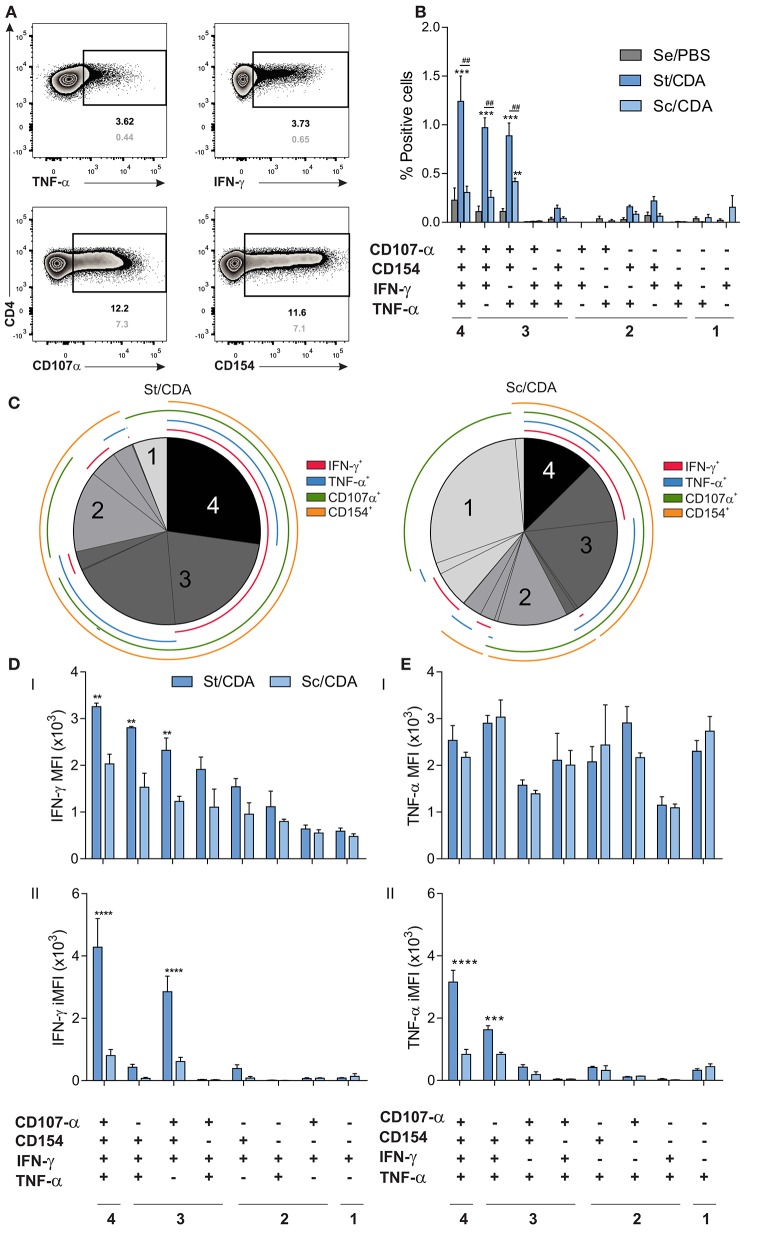
Figure 5.
Polyfunctionality analysis of the CD4 T-cell compartment by flow cytometry. Female C3H mice were vaccinated as indicated, and 20 days post-immunization, spleen cells were restimulated ex vivo with Traspain. Surface and intracellular staining was performed, and Boolean combination gate strategy was carried out in order to assess simultaneous production of IFN-γ, TNF-α, CD154, and CD107α. (A) Representative Zebra plots showing the individual gates included in the Boolean combination strategy for the CD4 compartment. Frequency of positive events upon antigen re-stimulation or RPMI are shown in black and gray respectively. (B) Bar chart showing the frequency of cytokine producing subsets within CD4 T lymphocytes. Values were background subtracted. ***p < 0.001, **p < 0.01 comparing with Se/PBS, ##p < 0.01, between indicated groups, n = 3 mice per group, two-way ANOVA + Tukey's multiple comparisons test. (C) Pie chart showing fraction of the antigen-specific response for all positive subsets. Concentric lines are drawn to show the composition of each subset. Hierarchy of (D) IFN-γ and (E) TNF-α expression within functionally defined subsets of cytokine-producing cells. Both mean fluorescent intensity, MFI (I) and integrated MFI (II) are shown. ****p < 0.0001 ***p < 0.001, **p < 0.01 comparing between groups, two-way ANOVA + Sidak's multiple comparisons test. All results are representative of two independent experiments.

