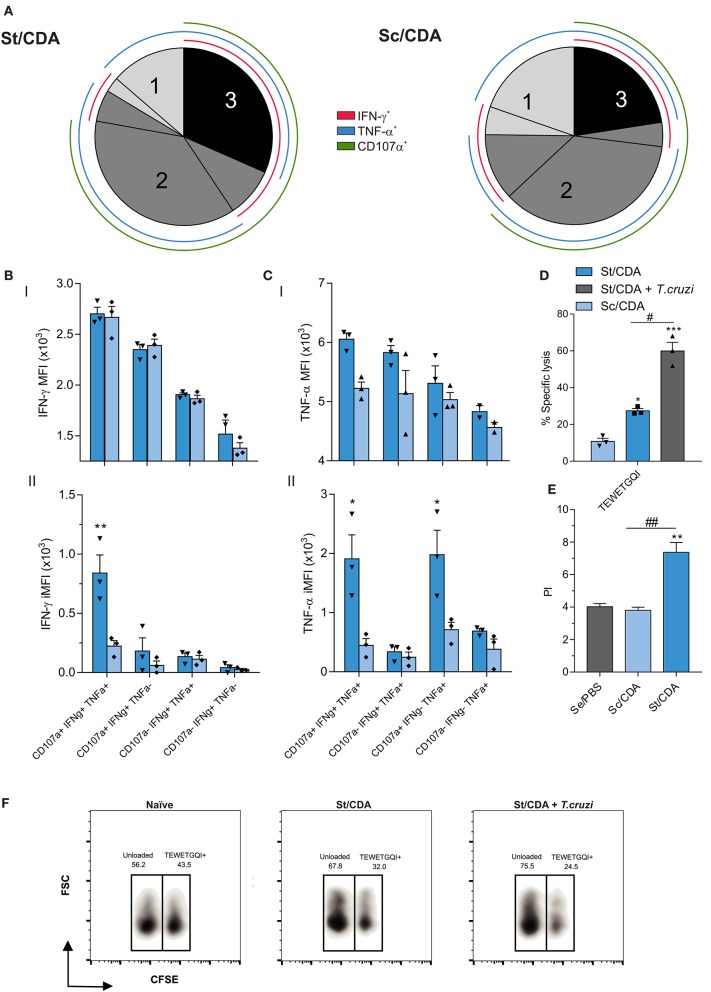
Figure 7.
Polyfunctionality analysis of CD8 T-cell compartment by flow cytometry. (A) Pie chart showing the percentage of each functional subset from the total antigen-specific response for female C3H vaccinated animals. Color coded concentric lines indicate each cytokine or marker. Hierarchy of (B) IFN-γ and (C) TNF-α expression within functionally defined subsets of responding cells. Both mean fluorescent intensity MFI (I) and integrated MFI (II) are shown. *p < 0.05 **p < 0.01 comparing between groups, two-way ANOVA + Sidak's multiple comparisons test. (D) in vivo CTL assay. Spleen cells from female C3H donor mice were loaded with TEWETGQI peptide or unloaded. Cells were stained with CFSE, and intravenously injected to syngeneic naïve, vaccinated (St/CDA, Sc/CDA) or St/CDA-vaccinated and T. cruzi RA infected mice at 45 dpi. *p < 0.05 ***p < 0.001 against Sc/CDA group. #p < 0.05, between the indicated groups, one-way ANOVA + Tukey's multiple comparisons test. Results are expressed as mean ± SEM, and represent at least three independent experiments, n = 3 per group. (E) 3H-Thymidine incorporation assay. Spleen cells from T. cruzi-RA-infected female mice were removed at 100 dpi and recalled with 20 μg/ml of F105 T. cruzi lysate. Results are expressed as proliferation index (PI). ##p < 0.01 between indicated groups. **p < 0.01 comparing with Se/PBS. one-way ANOVA + Tukey's multiple comparisons test, n = 6 per group. (F) Representative density-plot of in vivo CTL assay showing percentage of CFSE populations in the indicated groups. All results are representative of two to three independent experiments.

