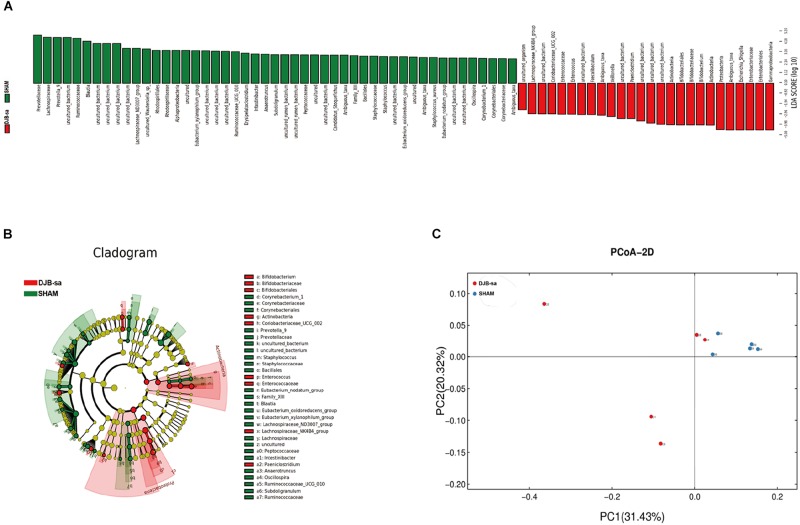
FIGURE 2.
Linear discriminant analysis effect size (LEfSe). (A) The Histogram represents the relative abundances at phylum, class, order and family levels between the DJB-sa group and the SHAM group at 8 weeks post-surgery. (B) The Cladogram of plots presented the LEfSe results of the biological structure of the gut microbiome. Gut bacteria marked with small circles highlight significant differences of relative abundance between the two groups. (C) Principal coordinate analysis (PCoA) based on weighted Unifrac metrics indicating the different beta diversity of gut microbiota of the fecal samples in the two groups.

