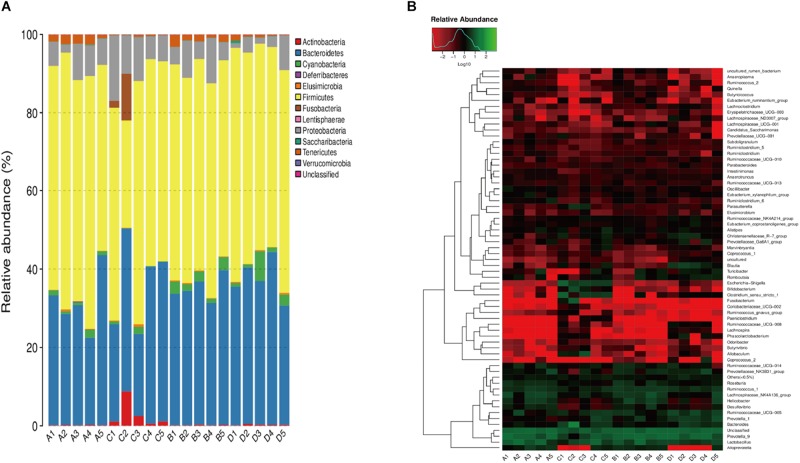
FIGURE 3.
A1–A5: DJB-sa group prior to surgery; B1–B5: SHAM group prior to surgery; C1–C5: DJB-sa group 8 weeks post-surgery; D1–D5: SHAM group 8 weeks post-surgery. (A) Relative abundance of the most abundant OTUs at the phylum level in fecal samples of GK rats. (B) Heatmap of the most abundant OTUs at the genus level in fecal samples. The color of the small rectangles in the graph represents the relative abundance of each genus in each sample. The quantity of relative abundance is indicated by the variation of color from blue to red. Blue represents a reduction and red indicates an increase.

