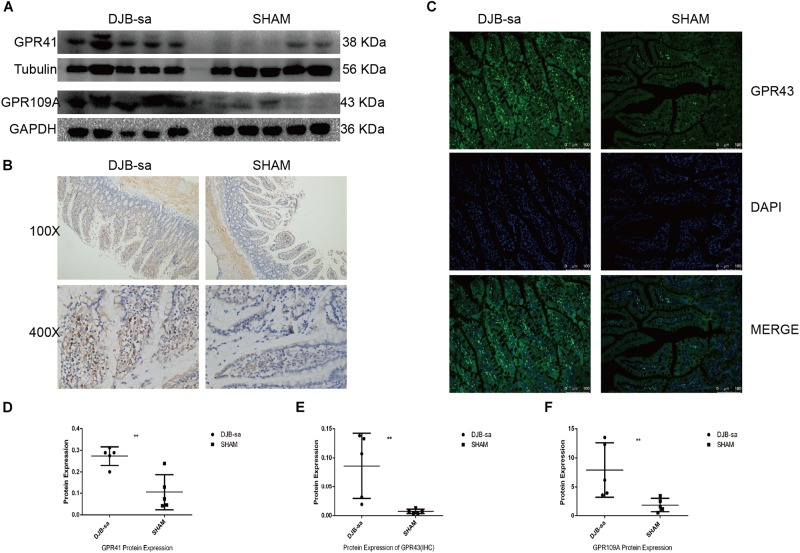
FIGURE 5.
(A) The left five bars represent the expression of GPR41 and GPR109a in intestinal tissues from the DJB-sa group and the right five bars represent their expression in the SHAM group. (B) Change of GPR43 protein expression was assessed using immunohistochemistry. Magnification 100×, the top half of (B); Magnification 400×, the bottom half of (B), Brown areas represent positive staining of GPR43. (C) Changes in GPR43 protein expression in the intestines assessed using immunofluorescence. Magnification 200x. The cell nucleus was stained blue with DAPI. Green spots indicate the positive fluorescence staining of GPR43. (D) GPR41 expression was increased in the intestines detected by western blotting. (E) Statistically significant increase of GPR43 expression in intestinal tissues in the DJB-sa group as detected by immunohistochemistry. (F) GPR109A expression was increased in the intestines as detected by western blotting. Differences between the DJB-sa group and SHAM group were assessed by the paired Student’s t-test, **p < 0.01.

