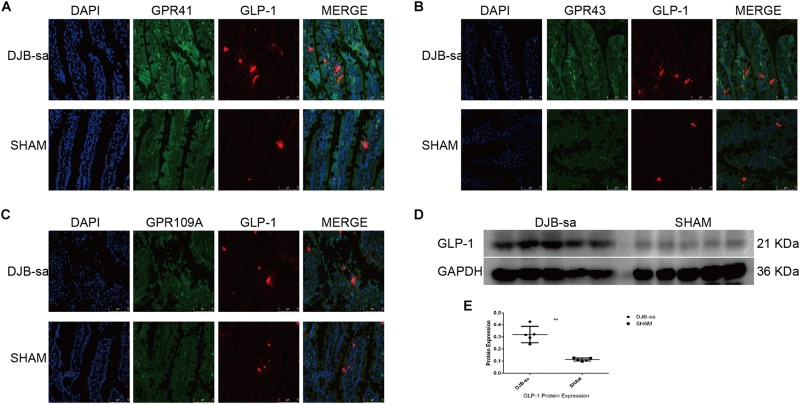
FIGURE 6.
(A) The co-expression of GPR41 and GLP-1 in intestinal tissues. The nuclei were stained with DAPI (blue spots). The green spots represent positive expression of GPR41. The red spots indicate the positive fluorescence staining of GLP-1. Magnification 400x. (B) The co-expression of GPR43 (green spots) and GLP-1 (red spots). Magnification 400x. (C) The co-expression of GPR109A (green spots) and GLP-1 (red spots). Magnification 400x. (D) Differences in expression of GLP-1 following DJB-sa compared with SHAM surgery. The left five bars represent the expression of GLP-1 in intestinal tissues from the DJB-sa group and the right five bars represent its expression in the SHAM group. (E) The GLP-1 expression was increased in the intestines as detected by western blotting. Differences between the DJB-sa group and SHAM group were assessed by the paired Student’s t-test, **p < 0.01.

