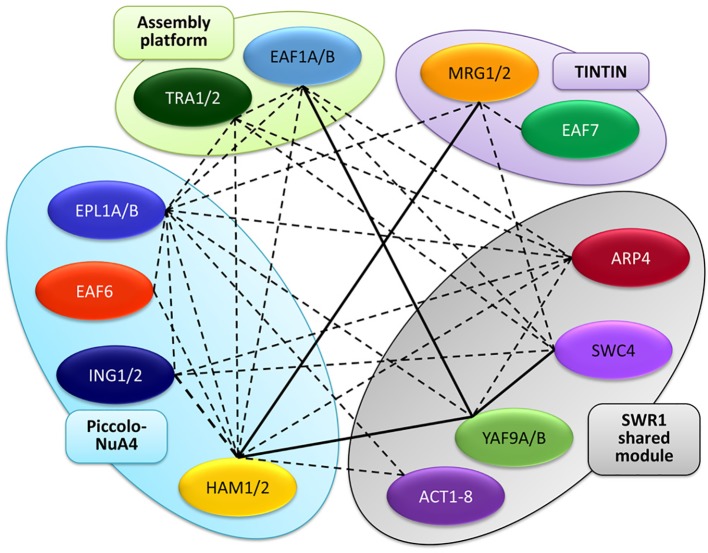
Figure 2.
Interaction map among NuA4 subunits in A. thaliana. The different homologs are grouped into the different sub-modules of the complex, similarly to Figure 1 . Continuous lines represent interactions demonstrated by pair-wise protein-protein experiments, whereas dotted lines depict interactions revealed in proteomic experiments.

