Figure 1.
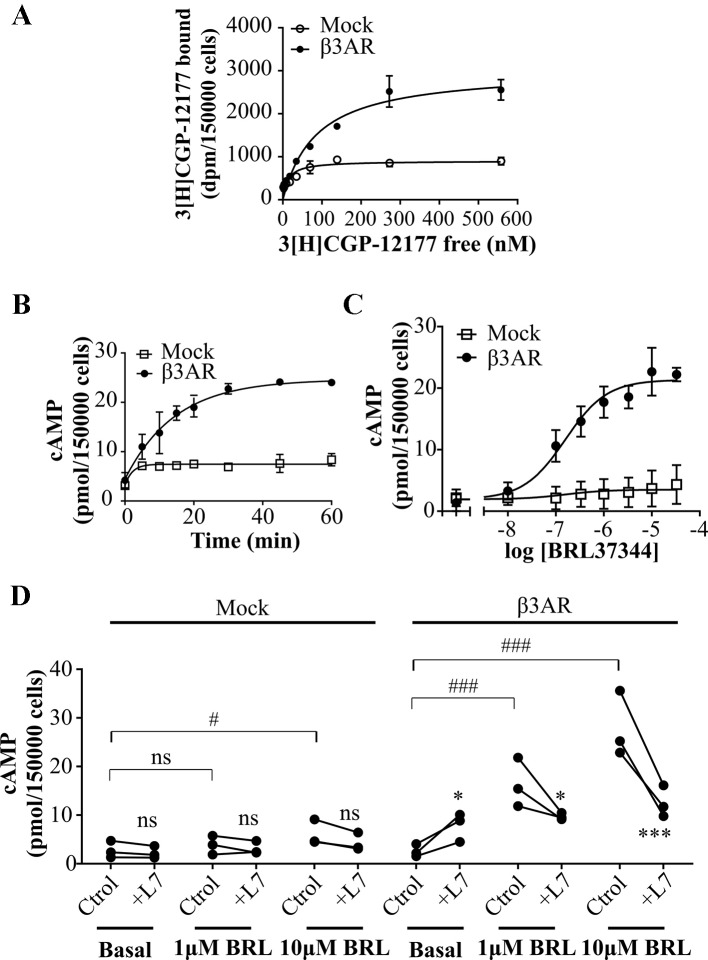
Characterization of cAMP response to β3AR stimulation. (A) HEK293T cells transfected with Mock or β3AR were incubated with different concentrations of 3[H]-CGP12177 as stated in Materials and Methods. Data represent mean ± SD (n=3). Best-fit values of the parameters are in the main text. Comparison of Kd and Bmax from both binding curves were done by extra sum of squares F-test. (B) HEK293T Mock or β3AR transfected cells were treated during different time periods with 10µM BRL37344, in presence of IBMX. Data represent mean ± SD (n=3). (C) HEK293T Mock or β3AR transfected cells were pre-treated with IBMX for 3 min and stimulated with indicated concentrations of BRL37344 for 30 min. Data represent mean ± SD (n=3). Best-fit values of the parameters are in the main text. (D) Effect of 10µM L748337 (L7) over basal or stimulated cAMP levels in response to 1μM or 10µM BRL37344 (BRL) in HEK293T Mock or β3AR transfected cells. Each data point represents a single experiment and data in absence or presence of L7 from the same experimental day are connected by lines (n=3). Data were analyzed by two-way ANOVA followed by Bonferroni post-test. ns, not significant; *P < 0.05; ***P < 0.001 respect to Ctrol. ns, not significant; #P < 0.05; ###P < 0.001 as indicated. cAMP accumulation was quantified as described under Materials and Methods.

