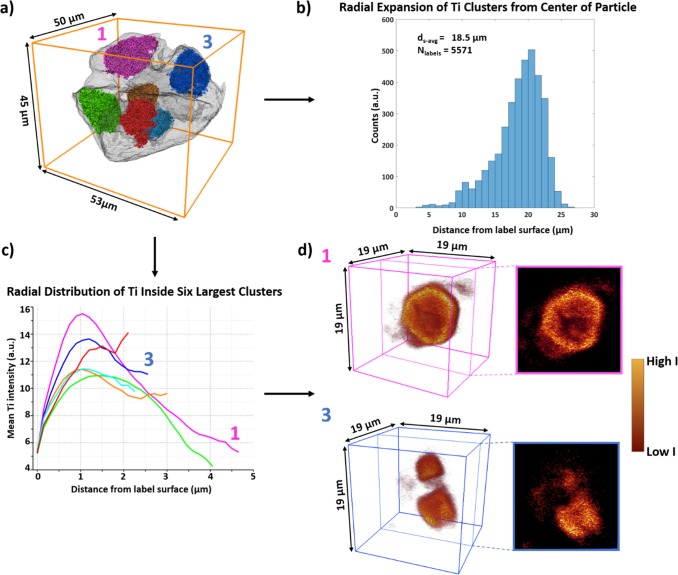
Figure 3.
(a) The six largest Ti cluster labels (Table 1 color coding) shown within the composite particle surface rendering. (b) Histogram showing the distance from the surface, ds, of all labels larger than 4 voxels in volume (5571 labels) with respect to the composite particle’s center. (c) The radial distribution of Ti within the six largest labels is calculated as a function of the mean Ti intensity from the surface of each corresponding label toward the center voxels. (d) 3-D cut-throughs and 2-D extracted slices of the Ti clusters within respectively label #1 pink and label #3 blue visualizing the fragmentation behavior.

