Figure 4.
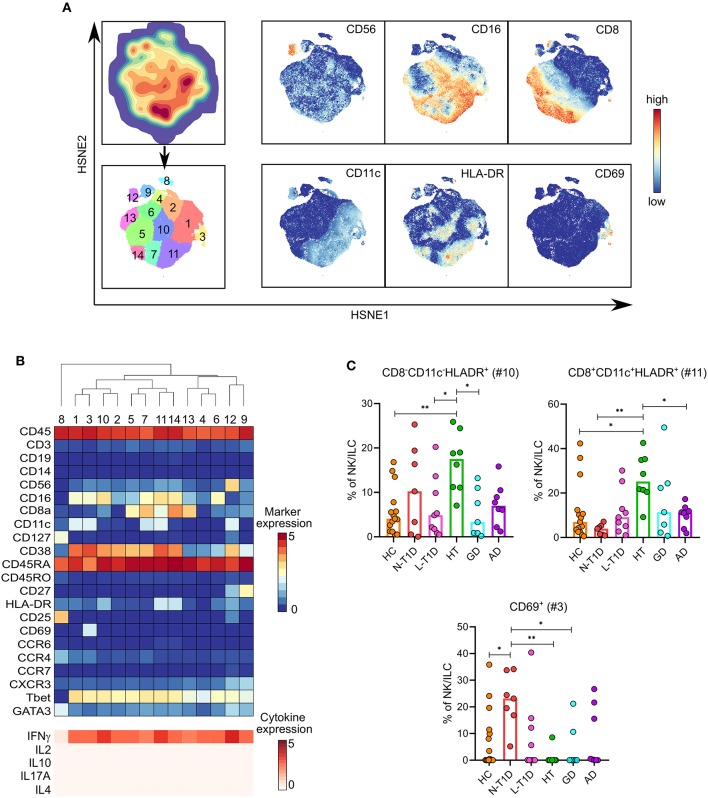
Alterations in distinct CD56dim NK cell clusters in patients with new-onset type 1 diabetes and Hashimoto's thyroiditis. (A) HSNE-embedding depicting the local probability density of CD56+ NK cells and ILC (upper first left) and the subsets defined by Gaussian mean-shift clustering (lower first left). Relative expression of selected markers in embedded CD56+ NK cells and ILC. (B) Heatmap showing ArcSinh5-transformed median expression of relevant markers (top) and differential median ArcSinh5-expression of cytokines after PMA/ionomycin stimulation (bottom) within the clusters identified in (A). The dendrogram depicts hierarchical clustering of subsets. (C) Frequencies of CD69+ (#3), CD8−CD11c−HLA-DR+ (#10), and CD8+CD11c+HLA-DR+ (#11) NK cells in healthy controls (HC, n = 15) and patients with new-onset (N-T1D, n = 7) and long-standing (L-T1D, n = 9) type 1 diabetes, Hashimoto's thyroiditis (HT, n = 8), Graves' disease (GD, n = 7) and autoimmune Addison's disease (AD, n = 8). Dots represent individual samples and bars indicate median. One-way ANOVA with Tukey's test for multiple comparisons, *p < 0.05 and **p < 0.01. HSNE, hierarchical stochastic neighbor embedding; ILC, innate lymphoid cells.

