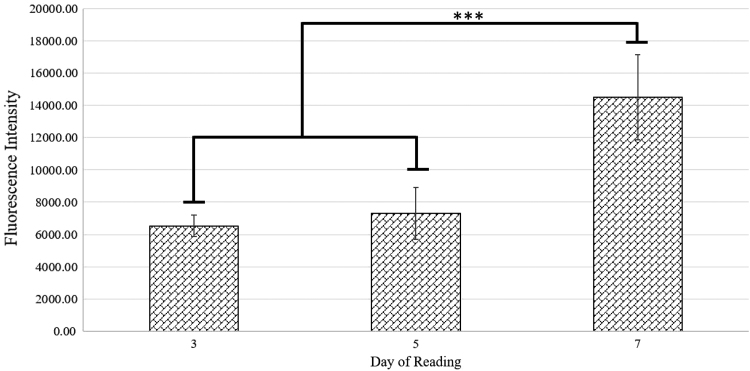
FIG. 1.
Calcein-AM proliferation assay conducted at days 3, 5, and 7 time points. Fluorescent intensity measurement output by plate reader is normalized to blank scaffold readings. The significant increase in fluorescence intensity between day 7 readings and previous time points is indicated by asterisks.

