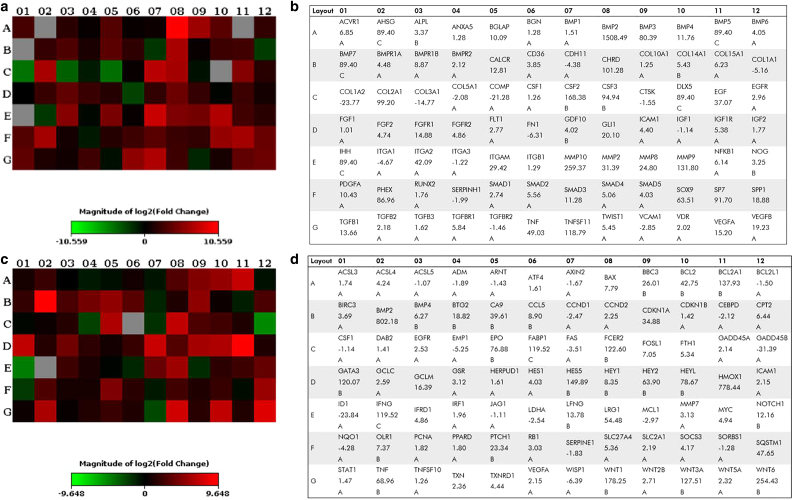
FIG. 2.
(a, c) Heatmap and (b, d) gene primer with expression values generated from human osteogenesis (a, b) and signal transduction arrays (c, d). Heatmaps utilize a Log2 scale and represent expression fold changes in cell-seeded materials relative to differentiated cell monolayers. Complimentary gene primer lists display numerical expression fold change values for heatmaps with associated rankings shown directly below values. Rankings are assigned using Qiagen Data Center processing and indicate the quality of the expression relationship based on cycle threshold values of polymerase chain reaction runs. Primary attention was given to unranked and rank “A” genes, as these were most reliable values.

