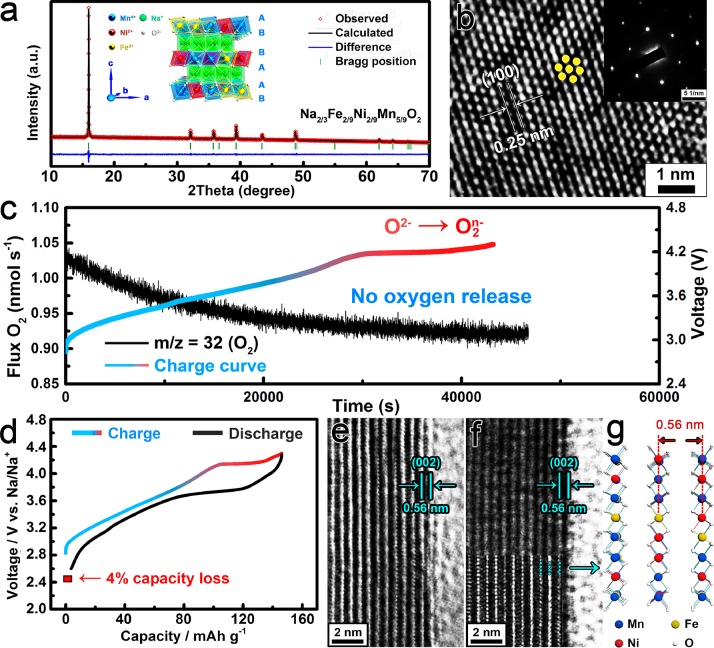
Figure 4.
(a) XRD and Rietveld plots of the Na2/3Fe2/9Ni2/9Mn5/9O2 sample. The inset shows the P2 type structure with “ABBAAB” arrangement. (b) HRTEM image of the Na2/3Fe2/9Ni2/9Mn5/9O2 sample. The inset image is the corresponding SAED pattern. (c) In situ DEMS analysis of oxygen evolution during the first charge for Na2/3Fe2/9Ni2/9Mn5/9O2 electrode. The current density is 10 μA mg–1, and the cut off voltage is 4.3 V. (d) Galvanostatic charge/discharge curves of the Na2/3Fe2/9Ni2/9Mn5/9O2 electrode and the irreversible capacity loss for the first cycle at 0.1 C. (e) HRTEM image at the pristine state. (f) HRTEM image after 1 cycle. (g) The P2 crystal structure for the surface layer.

