
Figure 2.
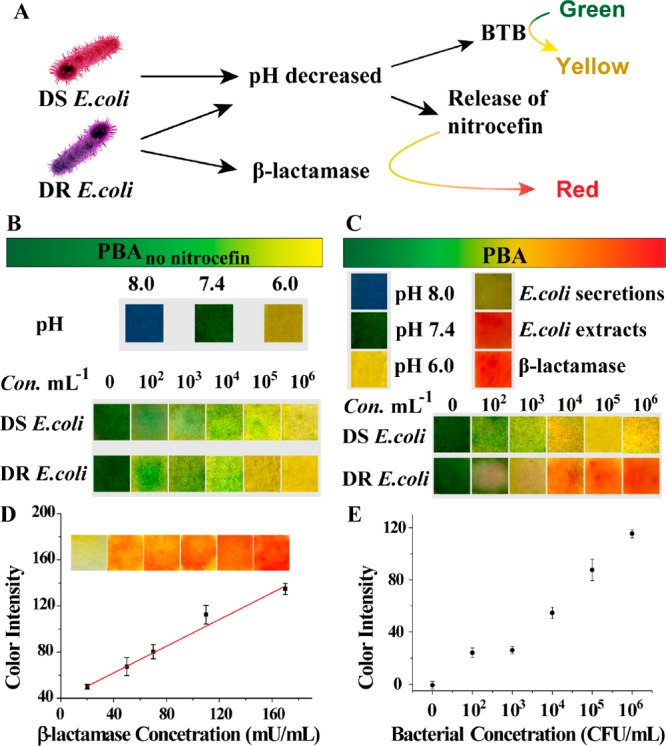
Use of PBA for sensing drug resistance. (A) The schematic diagram of PBA (green) for sensing bacterial infection (yellow) and drug resistance (red). The typical pictures of (B) PBAno nitrocefin and (C) PBA after incubation with buffer (pH 8.0–6.0), E. coli solution, bacterial secretions, and extracts for 4 h. (D) Quantitative analysis of PBA with different concentrations of β-lactamase ranging from 0.02 to 0.18 U/mL. The inset includes the typical images of PBA after reaction with β-lactamase. (E) Quantitative analysis of PBA with different concentrations of DR E. coli. The color intensity was calibrated by subtracting the mean intensity of DS E. coli group on each side of the DR E. coli group.