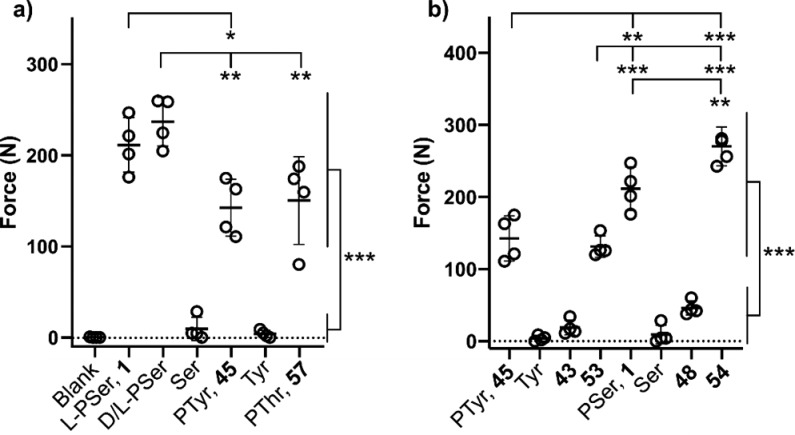
Figure 1.
Comparison of cement adhesive strength in CPCs containing phospho-amino acid analogue additives. (a) Comparison across amino acids. (b) Comparison across analogues missing functional handles. Data are represented as scatter dot plots of each individual data point with the bars indicating the mean ± SD. * represents significant differences between groups (* p < 0.05, ** p < 0.005, *** p < 0.001). Details of the statistical analysis are provided in the SI.

