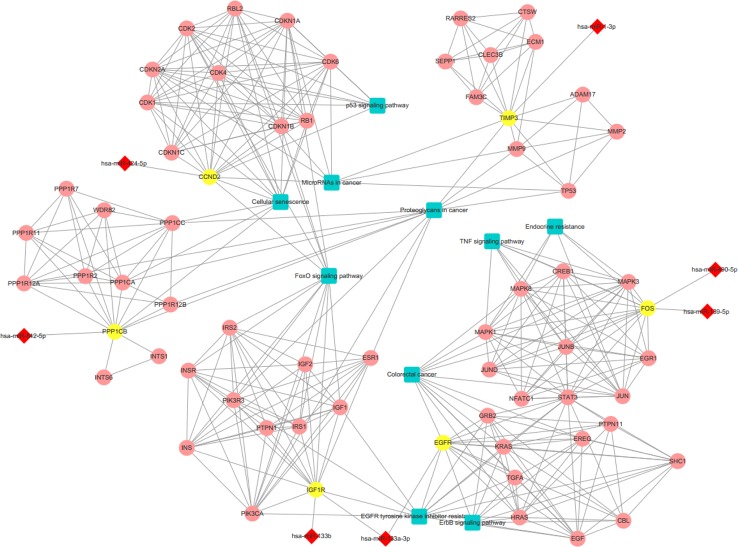
Figure 3.
The interaction network of differentially expressed miRNAs (DERs) and genes. The red diamond represents DERs in colorectal cancer (CRC) patients. The yellow circle represents the DER-target gene. The pink circle represents the gene that interacts with the target gene. The blue rectangle represents the annotated pathway of the target gene.

