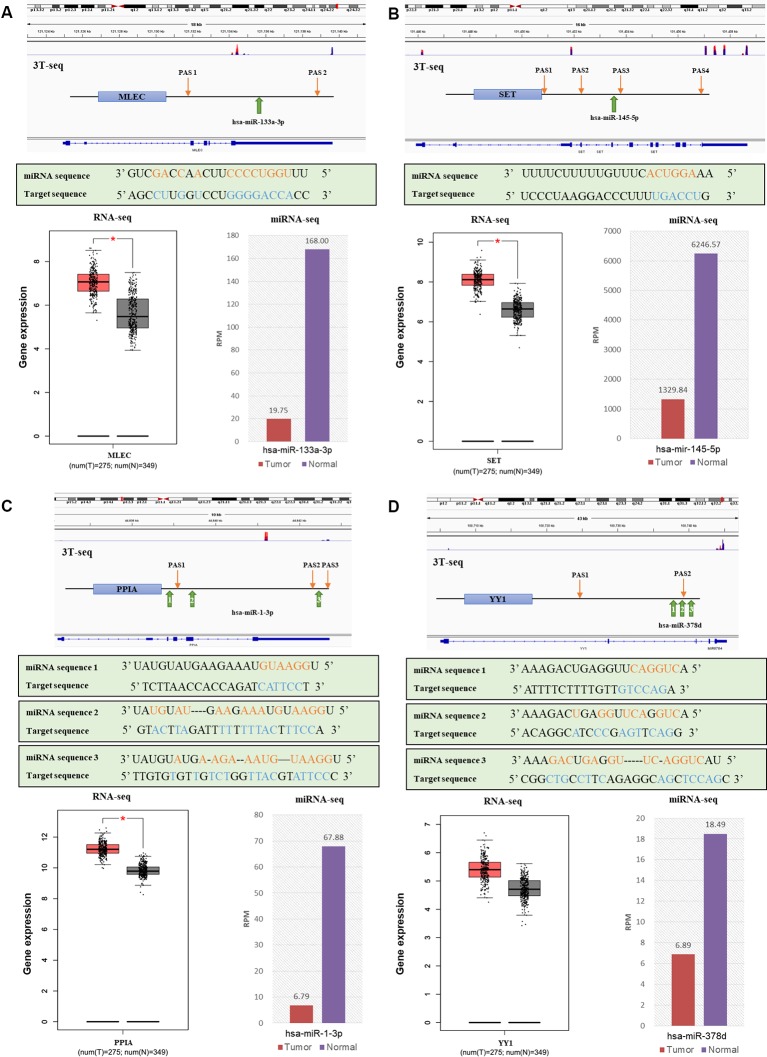
Figure 6.
The relationships of alternative polyadenylation (APA) alteration and microRNA (miRNA) binding sites lost with miRNA downregulation and target gene upregulation. (A) MLEC and hsa-miR-133a-3p. (B) SET and hsa-miR-145-5p. (C) PPIA and hsa-miR-1-3p. (D) YY1 and hsa-miR-378d. Each figure, from top to bottom are a genomic view of gene transcript isoforms with alternative poly(A) sites in colorectal cancer (CRC) tissues (overlay in red) and normal counterparts (overlay in blue); the schematic diagram of polyadenylation sites (PASs) relative location and miRNA binding sites of each gene; the miRNA mature sequence and the target sequence of each binding site, where complementary base are labeled orange and blue; the box plot of gene expression in CRC tissues (red) and normal tissues (grey); and the histogram of miRNA expression in CRC tissues (red) and normal counterparts (purple).

