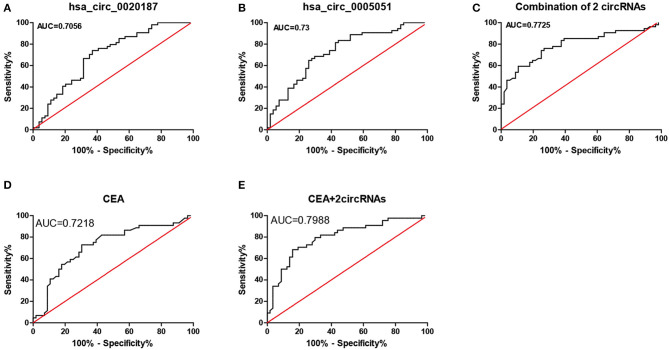
Figure 3.
ROC analysis of hsa_circ_0021087, hsa_circ_0005051, and the combination of the two molecular biomarkers were used in the diagnosis of GC. (A) The hsa_circ_0021087 area under the ROC curve (AUC) 0.7056, P < 0.001. (B) Hsa_circ_0005051: 0.73, P < 0.001. (C) Combination of 2 circRNAs: 0.7725, P < 0.001. (D) CEA: 0.7218, P < 0.001. (E) CEA and 2 circular RNAs: 0.7988, P < 0.001. ROC, receiver operating characteristic; AUC, area under the curve; CEA, carcinoembryonic antigen.

