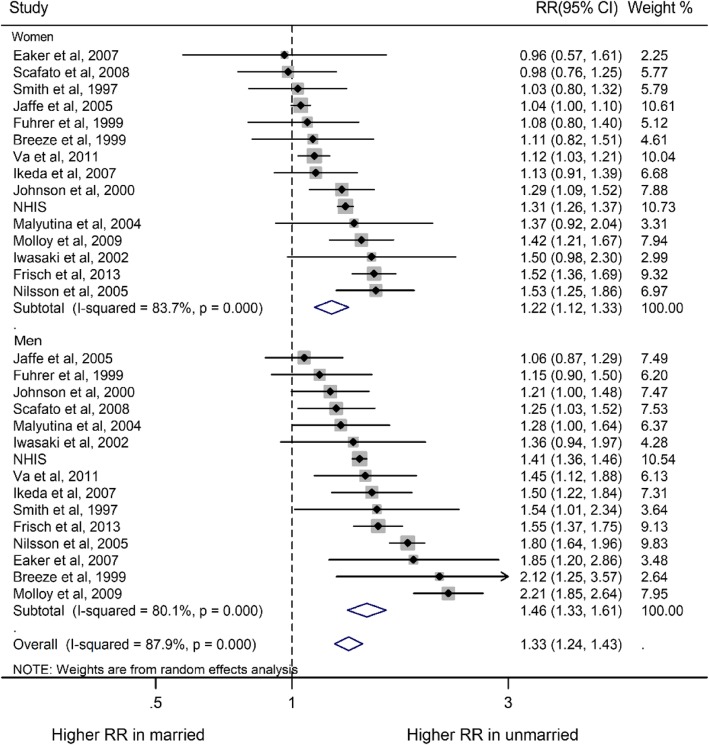
Fig. 2.
Sex-specific relative risks (RRs) for all-cause mortality, comparing non-married to married people. The boxes and lines indicate the RRs and their 95% confidence intervals (CIs) on a log scale for each study. The pooled odds ratio is represented by a diamond. The size of the gray squares indicate the relative weight of each estimate

