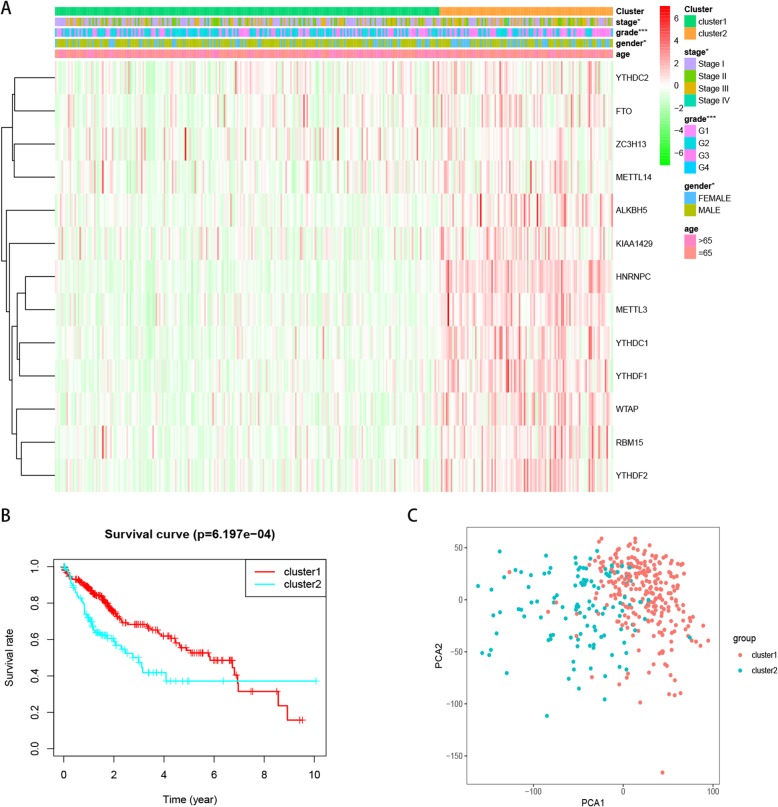
Fig. 2.
Differential clinicopathological factors and overall survival of hepatocellular carcinoma in the cluster 1/2 subgroups. a Heatmap and clinicopathological factors of the two clusters, Chi-square test was used for correlation between clinical and cluster, * P < 0.05 and *** P < 0.001. b Kaplan–Meier overall survival (OS) curves for 374 TCGA hepatocellular carcinoma patients. The sample size of cluster 1 and cluster 2 is 257 and 117 respectively. c Principal component analysis of the m6A-related gene expression in the TCGA dataset, hepatocellular carcinoma in the cluster1 subgroup are marked with red

