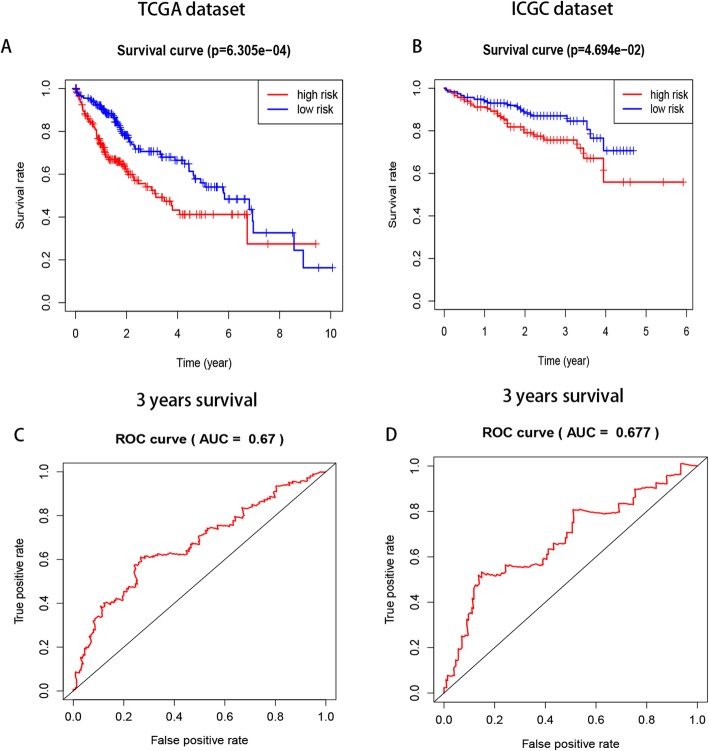
Fig. 4.
The differences in OS between the low-and high- risk groups based on the median risk score and ROC curve predict survival in TCGA and ICGC datasets. a-b significant differences in OS between the two categories (c-d) Kaplan–Meier overall survival (OS) curves for patients predicting 3 years survival in the TCGA (c) and ICGC (d) datasets assigned to high- and low-risk groups based on the risk score

