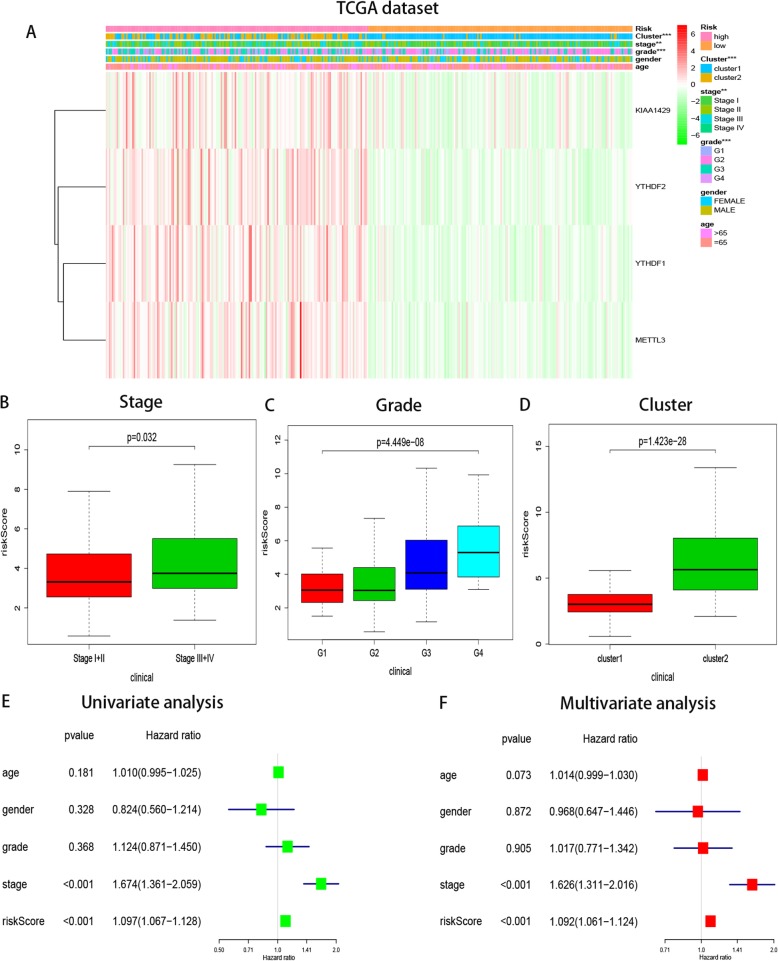
Fig. 5.
Relationship between the risk score, clinicopathological factors and cluster1/2 subgroups in TCGA dataset. a The heatmap shows the distribution of clinicopathological factors and four genes expression compared between the low- and high- risk groups. ** P < 0.01, *** P < 0.001. (b–d) Distribution of risk scores in the TCGA dataset stratified by WHO grade (b) pathological grade (c) and cluster1/2 subgroups (d). e-f Univariate and multivariate analyses of the association between clinicopathological factors (including the risk score) and overall survival of patients in the TCGA datasets, the hazard ratios (HR), 95% confidence intervals

