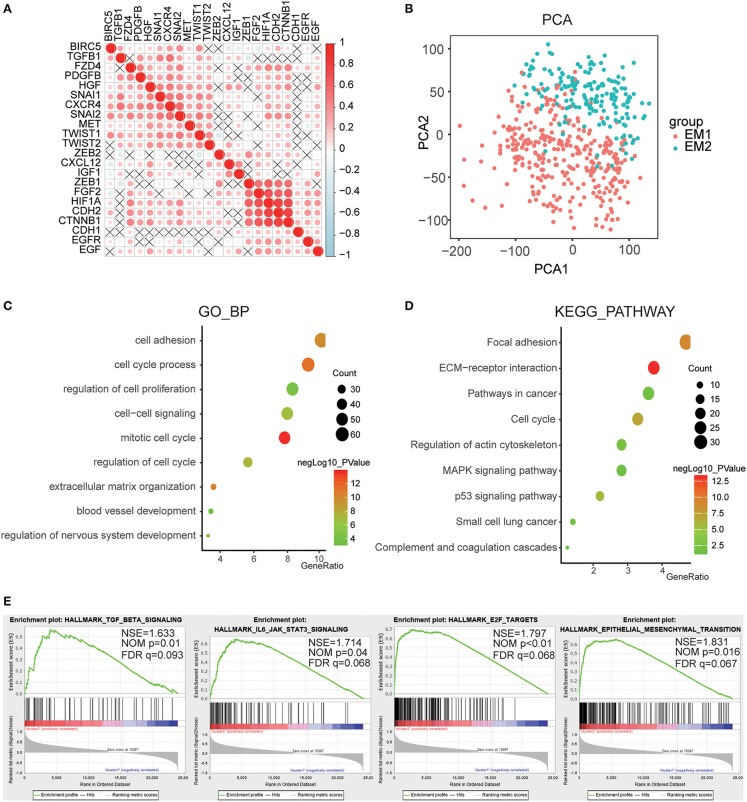
Figure 5.
Interaction among EMT related genes and functional annotation of gliomas in EM1/2 subgroups. (A) Spearman correlation analysis of the 22 EMT related genes. (B) Principal component analysis of the total RNA expression profile in the CGGA dataset. (C,D) Functional annotation of the genes with different expression between two subgroups using GO terms of biological processes (C) and KEGG pathway (D). (E) GSEA is used to annotate the malignant hallmarks of these genes with different expression levels between the two subgroups.

