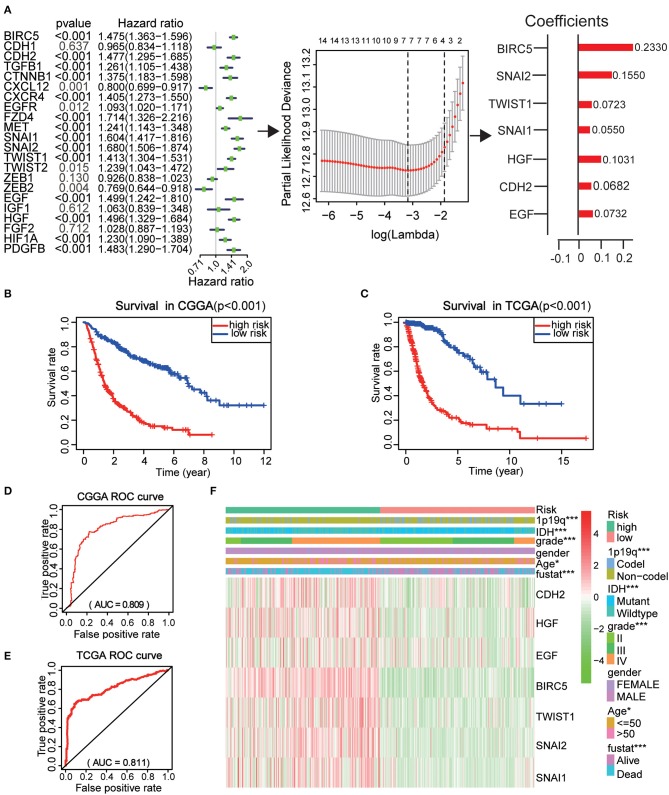
Figure 6.
Risk signature with seven EMT related genes. (A) The process of using seven genes to building the signature. (B,C) Kaplan–Meier overall survival (OS) curves for patients in the CGGA (B) and TCGA (C) datasets assigned to high- and low-risk groups based on the risk score. (D,E) The ROC curves of the risk signature in CGGA 9 (D) and TCGA (E) datasets. (F) The heatmap of the seven EMT related genes in low- and high-risk gliomas. The distribution of clinicopathological features was compared between the low- and high-risk groups. *P < 0.05 and ***P < 0.001.

