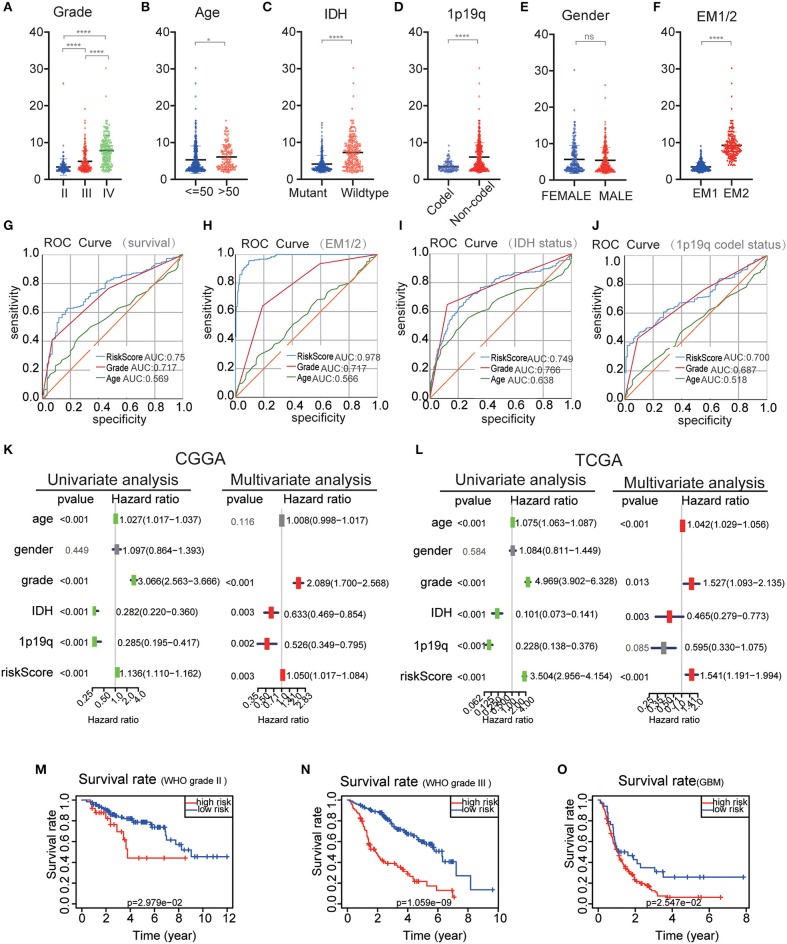
Figure 7.
Comparison of risk scores and clinicopathological features between RM1/2 subgroups and differences in different grades of glioma OS. (A–F) Distribution of risk scores in the CGGA dataset stratified by WHO grade (A), Age (B), IDH status (C), 1p/19q codel status (D), gender (E), and EM1/2 subgroups (F). ns no significance, *P < 0.05 and ****P < 0.0001. (G–J) The predictive efficiency of the risk signature, WHO grade, and age on the survival rate (G), EM1/2 subgroups (H), IDH-mutant status (I), and 1p/19q codel status (J) showed by ROC curves. (K,L) Univariate and multivariate Cox regression analyses of the association between clinicopathological factors (including the risk score) and overall survival of patients in the CGGA (K) and TCGA (L) datasets. (M–O) Kaplan–Meier survival curves with different WHO grade groups in the CGGA dataset.

