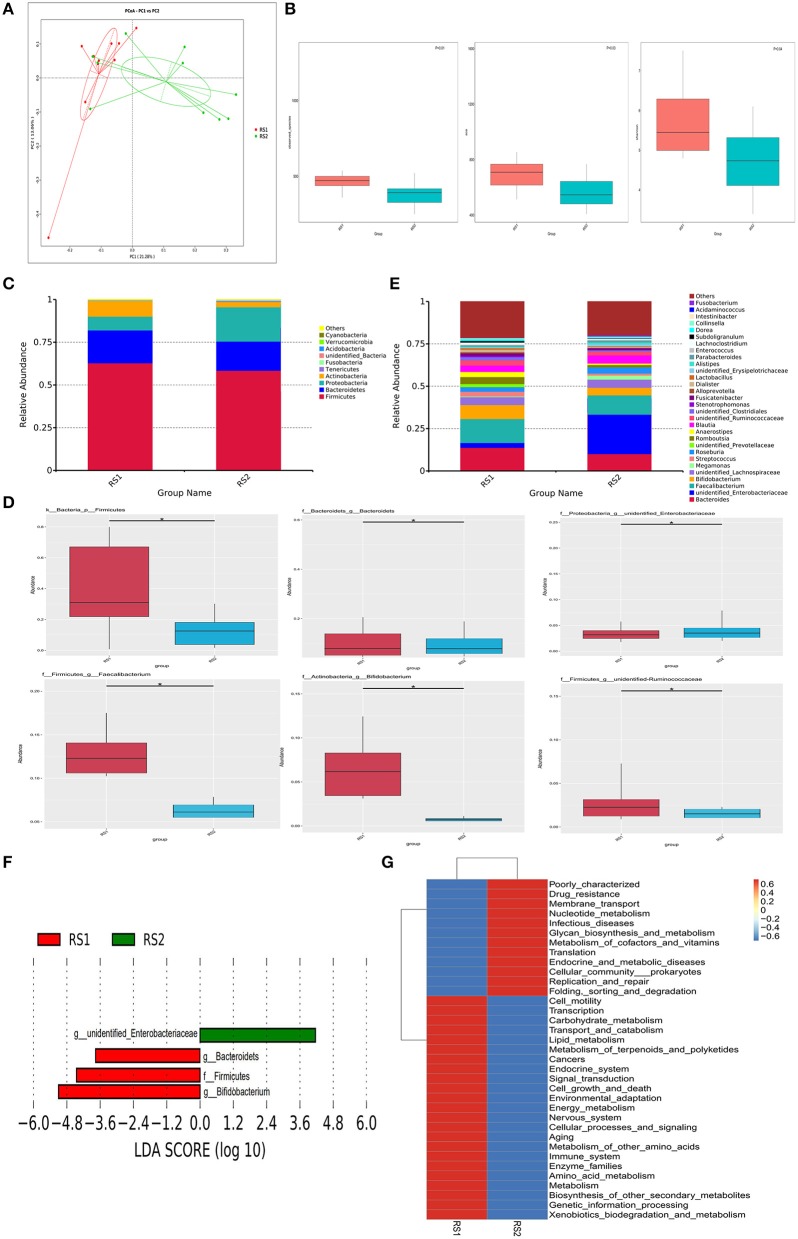
Figure 1.
Microbiome multivariate analysis. (A) Principal Component Analysis (PCoA) based on unweighted UniFrac distances between gut bacterial communities of CSU patients and healthy controls. (B) Alpha-diversity indexes for each sample group, showing the adjusted p-value computed using Wilcoxon rank sum test. (C) Bacterial composition and abundance in phylum level. Each bar represents the top ten bacterial species ranked by the relative abundance in CSU patients and healthy controls. (D) The relative abundance of significantly altered bacterial taxa including phylum, genus levels in the CSU group compared to that in the control group (*P < 0.05). (E) Taxonomic distributions of bacteria at the genus level (top 30) between CSU patients and healthy controls. (F) Lefse analysis was performed on the bacterial taxa relative abundance values between the two groups. Bacterial with LDA score >2.0 and P < 0.05 were considered to be significantly discriminant. (G) The effect of the altered gut microbiota on predicted functional metabolic pathways.

