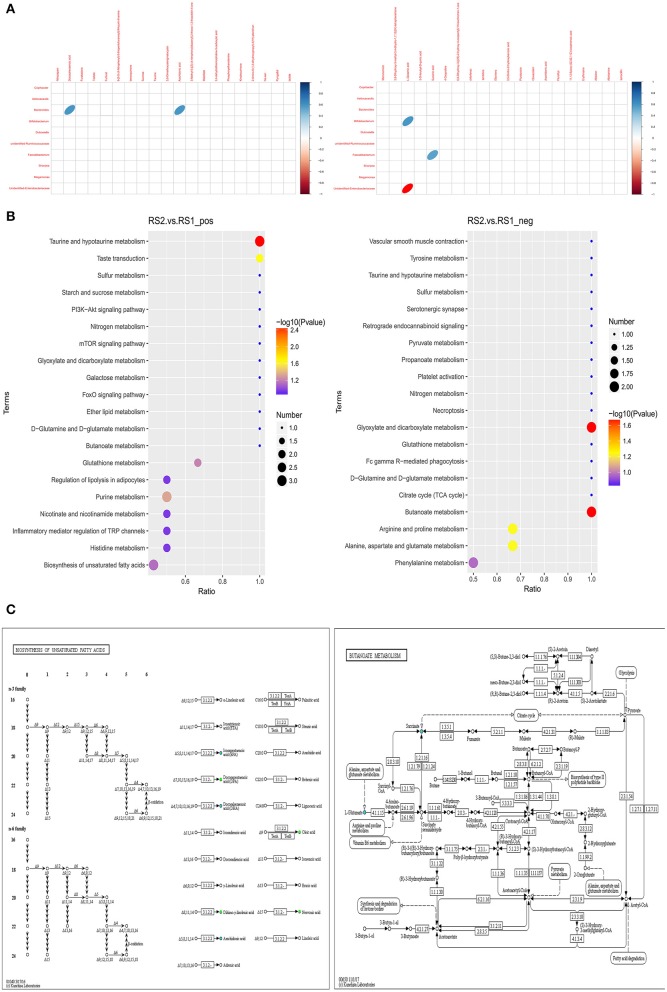
Figure 3.
Correlation analysis of differential gut microbiota and metabolites. (A) Heatmap of correlation between microbial genus abundances and serum metabolites in positive ion mode (left) and in negative ion mode (right). Only significant correlations (p ≤ 0.05) are colored. Positive correlations are indicated in blue and negative correlations in red. (B) Metabolites were annotated into different metabolic pathways between the positive ion mode (left) and in negative ion mode (right) by KEGG enriched bubble chart based on KEGG. (C) Metabolic pathway map in CSU patients. Green solid circles are marked as annotated metabolites, and blue circles are marked as down-regulated differential metabolites.

