
Figure 9.
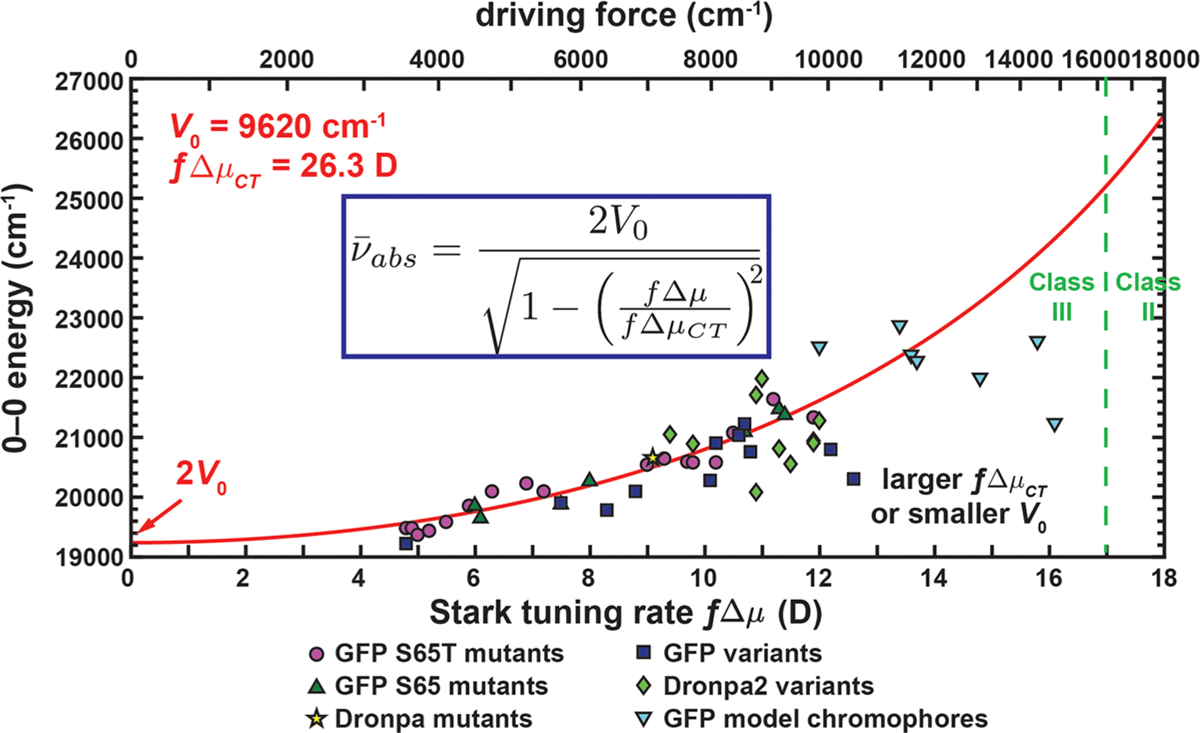
Correlation between Stark tuning rate and 0–0 transition energy for mutants, variants, and model chromophores of GFP and Dronpa at 77 K (Table S14 in the Supporting Information). The red curve comes from fitting the data for the S65T mutants to eq 2. The distinction between class II and class III systems is shown with a green dashed line. The local field factor f is required as a conversion factor between the observed and true Stark tuning rates (section S6 in the Supporting Information). Note that the Stark tuning rates of the model chromophores are obtained from the classical Stark analysis to be consistent with those of proteins, but their corresponding Stark spectra show nonclassical features (Figures S14 and S15 in the Supporting Information). See Figure S31 in the Supporting Information for an identical figure reproduced with numerical labels defined in Table S14. The driving force is related to the Stark tuning rate by eqs S13 and S21.