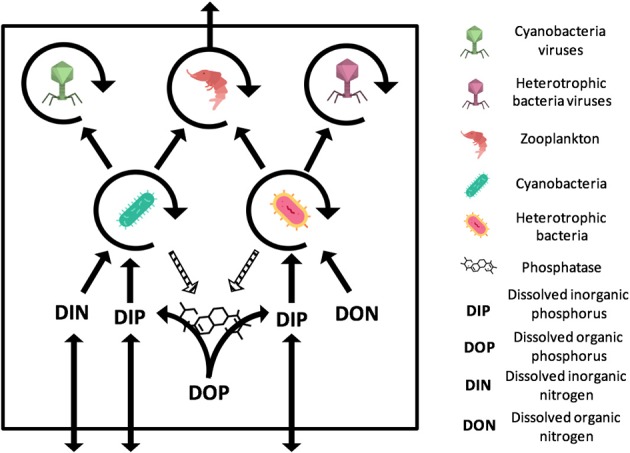
Figure 1.

General representation of the N- and P-limited models with viruses. The virus-free models only differ from the absence of viruses. The N-limited model contains DIN and DON while the P-limited model contains DIP and DOP. Full arrows stand for gains or losses for a variable when pointed to or away from that variable. Arrow circles around a variable represent the multiplication of that variable. Dashed arrows are used for the secretion of phosphatase, which comes at no direct cost for bacteria. The release of inorganic and organic nutrients by bacteria, zooplankton, and viruses is not represented. Import or export out of the system are represented by arrows that intersect the square outline. Contributions to the carbon sink are not represented. Icons made by Freepik and Smashicons from www.flaticon.com.
