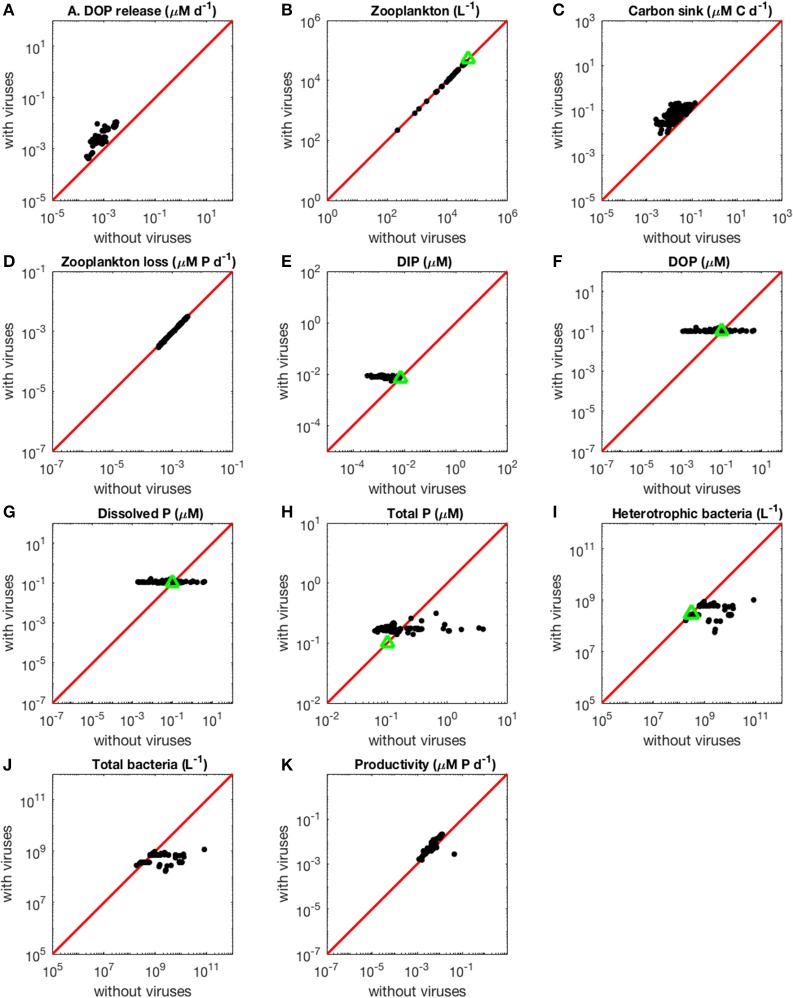
Figure 3.
Effect of viruses on steady-state concentrations and fluxes for the phosphorus-limited system. Cyanobacteria are not represented because they are not present in the virus-free system. The red line denotes the 1:1 line and the green triangles show target densities used in the optimization procedure. Each point stands for the steady concentration for one optimized parameter set. Points above and below the red line represent steady-state values that increased and decreased after introducing viruses, respectively. (A) Release of dissolved organic phosphorus by zooplankton and viruses. (B) Zooplankton abundance. (C) Carbon sink. (D) Export of phosphorus to higher trophic levels through zooplankton predation. (E) Dissolved inorganic phosphorus. (F) Dissolved organic phosphorus. (G) Total dissolved phosphorus (DIP and DOP). (H) Total phosphorus (dissolved and organismal). (I) Heterotrophic bacteria abundance. (J) Total bacterial abundance (heterotrophic bacteria and cyanobacteria). (K) Biomass production by heterotrophic bacteria and cyanobacteria.

