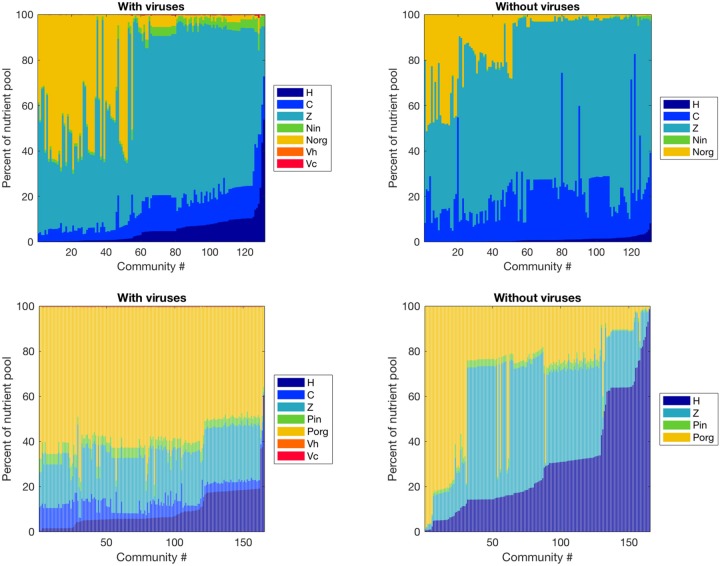
Figure 4.
Effect of viruses on the partitioning of the nutrient pool between all variables. The nutrients stored in each variable were calculated with equilibrium values and parameters, and we obtained percentages by dividing by the total amount of nutrient in the system. Top: Nitrogen-limited model. Bottom: Phosphorus-limited model. Communities are ordered by ascending order of the percentage of the nutrient pool stored in heterotrophic bacteria.

