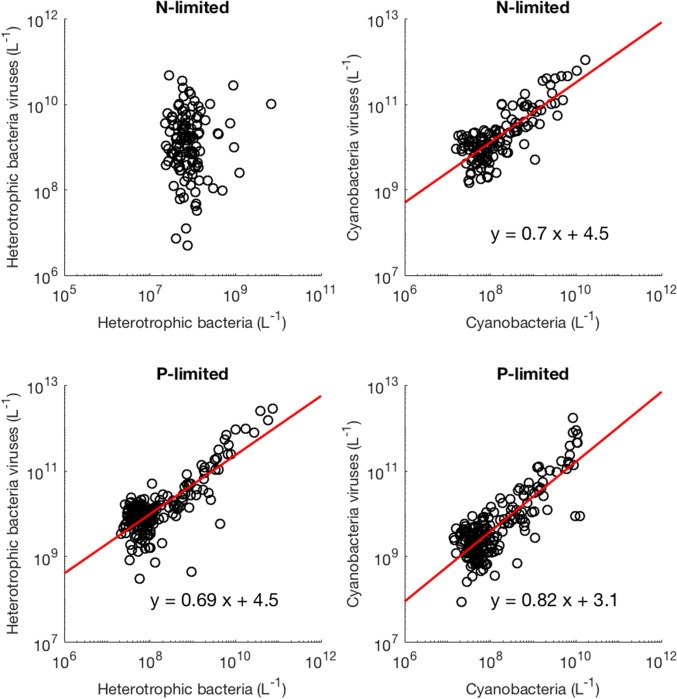
Figure 6.
Relationship between viruses and bacteria. The red line represents the best-fit line obtained through a linear regression in log-space. The best-fit line was not included if bacterial abundance was not a better predictor of viral abundance than the mean of viral abundance (intercept-only model).

