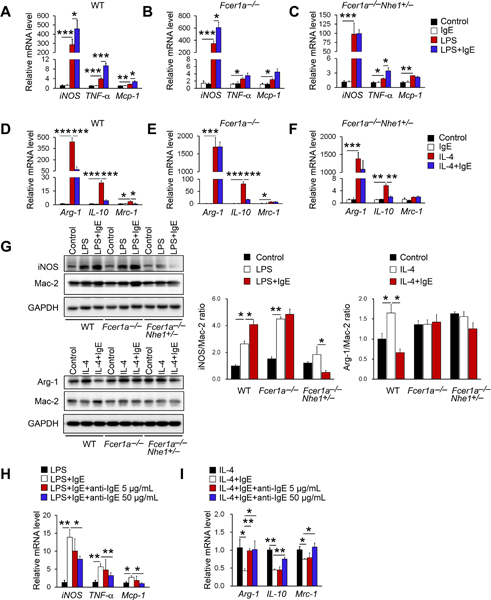
Figure 4.

IgE activity in macrophages polarization. RT-PCR analysis of M1 macrophage marker genes after 24 hrs LPS (100 ng/mL) stimulation with or without IgE (50 μg/mL) in BMDM from WT, Fcer1α−/−, and Fcer1α−/−Nhe1+/− mice (A-C). RT-PCR analysis of M2 macrophage marker genes after 24 hrs IL-4 (10 ng/mL) stimulation with or without IgE in BMDM from WT, Fcer1α−/−, and Fcer1α−/−Nhe1+/− mice (D-F). (G) Immunoblots detected the expression of iNOS and Mac-2 and quantification of iNOS to Mac-2 ratio after LPS stimulation or the expression of Arg-1 and Mac-2 and quantification of Arg-1 to Mac-2 ratio after IL-4 stimulation with or without IgE in BMDM from WT, Fcer1α−/−, and Fcer1α−/−Nhe1+/− mice. Representative immunoblot images are shown to the left. RT-PCR analysis of M1 macrophage marker genes after LPS stimulation (H) and M2 macrophage marker genes after IL-4 stimulation (I) with or without IgE and anti-IgE antibody in BMDM from WT mice. Data are mean±SEM from 4 independent experiments. *P<0.05, **P<0.01, ***P<0.001.
