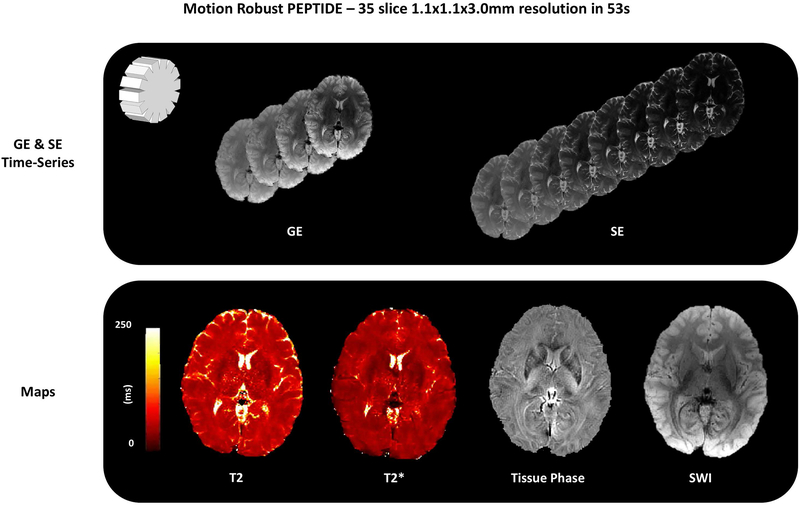
Figure 4 –
Example reconstructed images from a PEPTIDE acquisition. Through use of a gradient-echo and spin-echo sequence a time-series of both T2* and T2 images can be achieved through a single acquisition (a small sample of ~100 images shown). Results are demonstrated from a 35 slice, 1.1×1.1×3.0 mm3 resolution acquisition, taking 52s to acquire (10-blade PEPTIDE, total Tacq = 1.5 s/slice). Example T2, T2*, tissue phase and SWI maps calculated from these time-series are also demonstrated.

