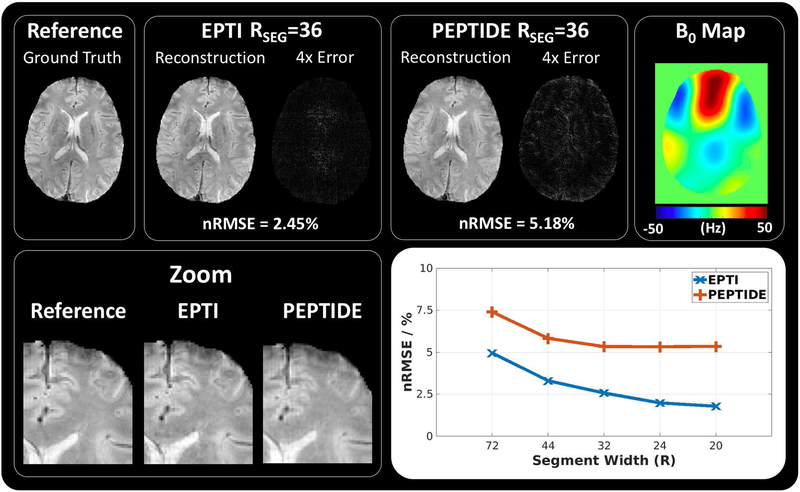
Figure 5 –
Simulations of EPTI and PEPTIDE. (top) Simulated ground truth data is compared to reconstructions of EPTI and PEPTIDE sampling, alongside the 4x error maps and calculated nRMSEs, demonstrated for the RSEG=36 (segment/blade width) case at TE=25ms. To the right the B0 map used in the simulation is shown. (bottom) On the left a zoomed-in region of each of the datasets is demonstrated. On the right an overview of the results is shown for RSEG values 72, 44, 32, 24 and 20, which use 3, 5, 7, 9 and 11 segments/blades respectively, for both EPTI and PEPTIDE.

