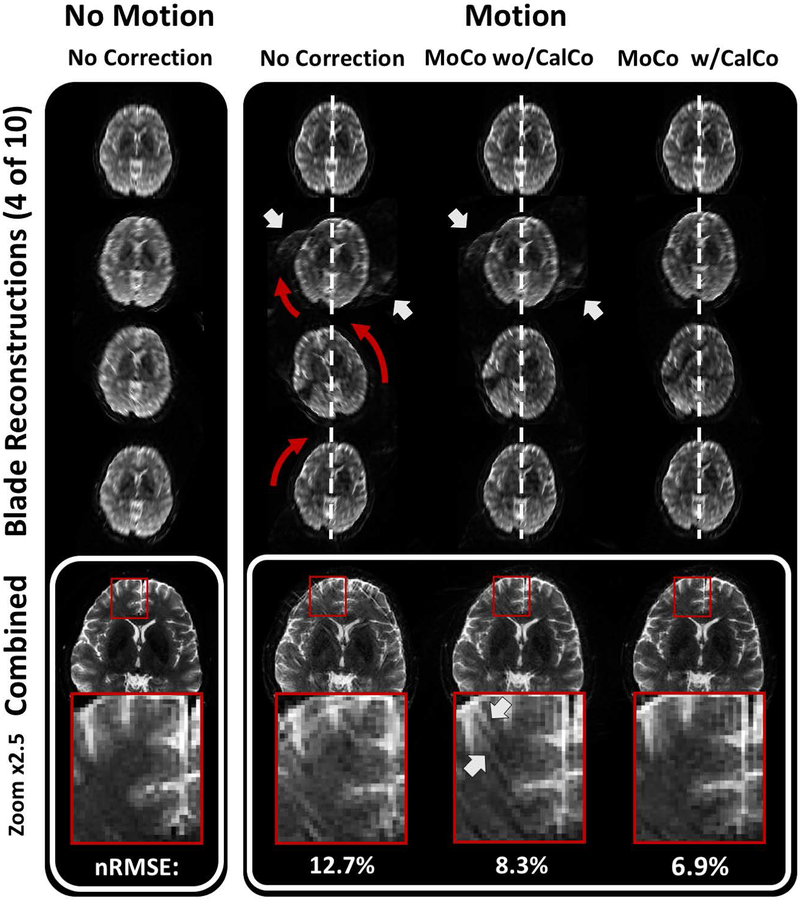
Figure 6 –
PEPTIDE motion correction. Example of the PEPTIDE motion-correction process through various stages. Four out of ten reconstructed low-resolution blades are demonstrated above the final combined image and a zoomed region of interest for a dataset with no included motion (left) and a dataset with included motion (right) for a reconstruction without MoCo, with blade MoCo, and with MoCo that additionally includes the motion estimate into the GRAPPA calibration data. Red arrows highlight the rotations in head positions between the blades. White arrows indicate residual parallel imaging artifacts. The sequential improvement in image quality, towards that of the case with no motion, can be seen.

