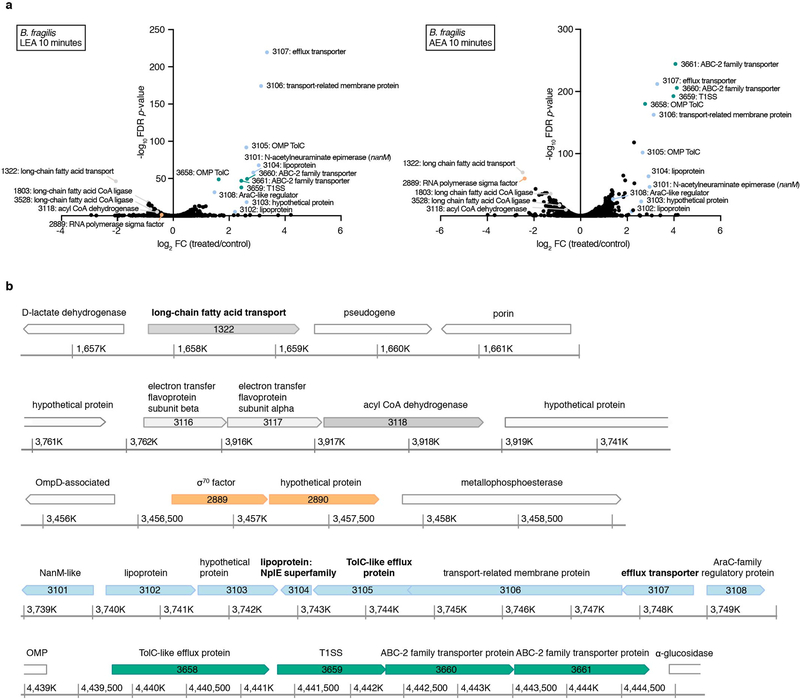
Extended Data Fig. 5. Transcriptional responses of Bacteroides fragilis to linoleoyl ethanolamide (LEA) and arachidonoyl ethanolamine (AEA).
(a) Differential gene expression between three independent exponential cultures treated for 10 minutes with a sub-inhibitory concentration (25 μM) of LEA or AEA and controls (0.04% DMSO). Differential expression was determined with edgeR, and gene functions were defined using InterPro (EMBL), the NCBI Conserved Domain Database (CDD) and the Kyoto Encyclopedia of Genes and Genomes (KEGG) database. Selected significantly differentially expressed genes (|log2 fold-change (treated/control)|>0.5, FDR<0.05; Benjamini-Hochberg FDR values were derived from p-values calculated using the likelihood-ratio test) are shown in color. (b) Genomic environment of the differentially expressed genes using colors that correspond with (a). Genes in white were not significantly differentially expressed. Coordinate maps refer to the genome of strain B. fragilis ATCC 25285. Gene products that have been experimentally shown to be associated with the outer membrane by LC-MS/MS analysis are in bold66.

