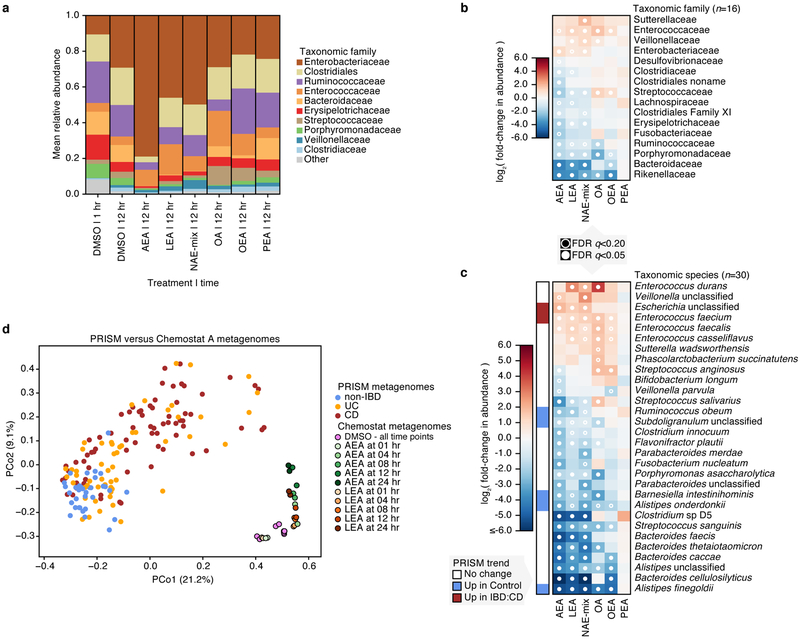
Figure 4. Effects of N-acylethanolamines on the composition of a complex microbial community.
(a) Taxonomic abundances in chemostat A at the family level. Vertical colored bars represent the relative abundance of bacterial families in samples 1 and 12 hr after addition of DMSO (0.5%), individual NAEs, or a combination of all four NAEs (denoted as NAE-mix). Oleic acid (OA), the fatty acid form of OEA, was also tested. Individual NAEs and OA were added to a final concentration of 500 μM. In combination, the PEA:OEA:LEA:AEA ratio was 125:125:125:125 μM. Heatmaps show log2 fold-changes in (b) family- and (c) species-level taxonomic abundances between treated samples and DMSO controls (total n=66 with per-treatment n ranging from 8 to 10). Species that shifted with statistical significance in response to treatment are shown (*q<0.20, **q<0.05; FDR q-values derived from nominal two-tailed p-values of the “treatment” coefficient across per-taxon linear regression analyses). Species enriched (red) and depleted (blue) in PRISM CD stool relative to controls (q≤0.1) are indicated. (d) Principal coordinate (PCo) analysis on Bray-Curtis dissimilarities between chemostat A (n=29) and PRISM (n=155) metagenomes. Times of exposure to AEA, LEA and DMSO control are indicated.

