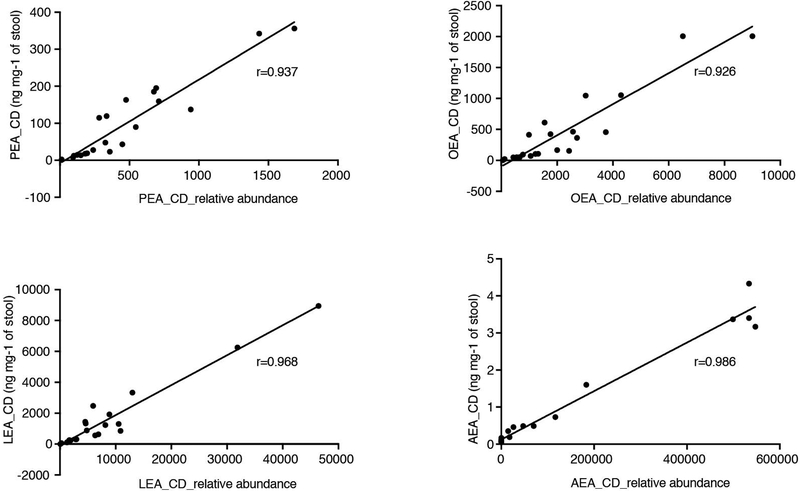
Extended Data Fig. 2. Correlation between absolute and relative NAE abundances in stool from PRISM subjects.
NAEs detected in stool from PRISM Crohn’s disease (CD) patients (n=21) in absolute abundances (ng mg−1) are plotted against their respective relative abundances8. Pearson correlation coefficients (r) are shown. Progenesis QI (nonlinear DYNAMICS) was used for the extraction of non-targeted LC-MS features and TraceFinder (Thermo Fisher Scientific) was used for the manual peak extraction of known metabolites on basis of their mass to charge ratio (m/z) and retention times determined using authentic standards. Abbreviations: PEA, palmitoylethanolamide; OEA, oleoyl ethanolamide; LEA, linoleoyl ethanolamide; AEA, arachidonoyl ethanolamide.

