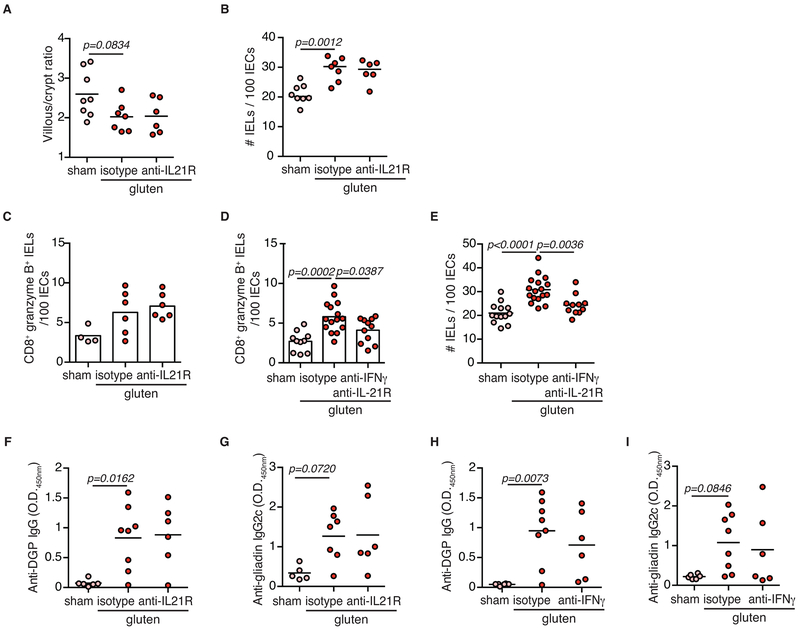
Extended Data Figure 9. Impact of IFN-γ and IL-21 neutralization on the development of coeliac disease.
(A-I) DQ8-Dd-villin-IL-15tg mice were treated with 500 μg of anti-IFNγ (clone XMG1.2) and/or anti-IL21R (clone 4A9) antibodies or corresponding isotype controls (rat IgG1 and rat IgG2a, respectively) once prior to, and every 3 days during the course of gluten feeding as indicated in the panels.
(A) Ratio of the morphometric assessment of villous height to crypt depth. Data are representative of two independent experiments shown as mean (sham, n=8, gluten + isotype, n=7, gluten + anti-IL-21R, n= 6). ANOVA / Tukey’s multiple comparison.
(B) Quantification of IELs among IECs was performed on H&E stained ileum sections. Two independent experiments (sham, n=8, gluten + isotype, n=7, gluten + anti-IL-21R, n= 6); mean; ANOVA / Tukey’s multiple comparison.
(C) The intestinal epithelium was isolated and analyzed by flow cytometry. IELs were identified as TCRβ+ CD4− CD8+ cells. Granzyme B+ IELs are indicated by absolute number / 100 IECs. Data are representative of two independent experiments shown as mean (sham, n=8, gluten + isotype, n=7, gluten + anti-IL-21R, n= 6).
(D) Granzyme B+ IELs are indicated as in (C). Four independent experiments (sham, n=12, gluten + isotype, n=16, gluten + anti-IL-21R + anti- IFN-γ, n= 11); mean; ANOVA / Tukey’s multiple comparison.
(E) Quantification of IELs among IECs was performed on H&E stained ileum sections. Four independent experiments (sham, n=13, gluten + isotype, n=17, gluten + anti-IL-21R+ anti- IFN-γ, n= 11); mean; ANOVA / Tukey’s multiple comparison.
(F-G) Serum anti-DGP IgG (F) and anti-gliadin IgG2c (G) levels were measured by ELISA. Sera were collected thirty days after gluten feeding. Two independent experiments (sham, n=5 and 6, gluten + isotype, n=8 and 7, gluten + anti-IL-21R, n= 6); mean; ANOVA / Tukey’s multiple comparison.
(H-I) Serum anti-DGP IgG (H) and anti-gliadin IgG2c (I) levels were measured as in (F-G). Two independent experiments (sham, n=6 and 6, gluten + isotype, n=8, gluten + anti- IFN-γ, n= 6); mean; ANOVA/ Tukey’s multiple comparison.

