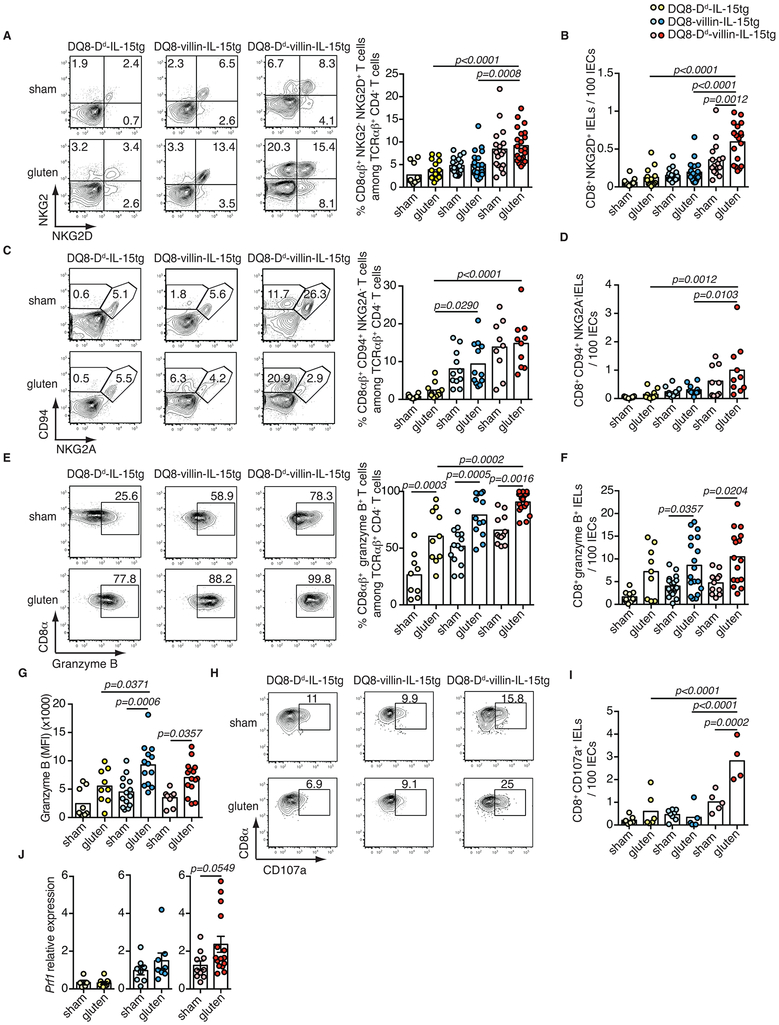
Extended Data Figure 2. Acquisition of cytotoxic properties by intraepithelial lymphocytes requires IL-15 expression in both the lamina propria and epithelium.
(A-J) DQ8-Dd-IL-15tg, DQ8-villin-IL-15tg, and DQ8-Dd-villin-IL-15tg mice were maintained on a GFD (sham) or fed with gluten for 30 days (gluten).
(A-I) The intestinal epithelium was isolated and analyzed by flow cytometry. A subset of IELs was identified as TCRβ+ CD4− CD8αβ+ cells. In parallel, total IELs were identified as TCRβ+ CD4− CD8+ cells by flow cytometry and quantified among IECs on H&E stained ileum sections.
(A) Percentage of NKG2D+ NKG2− CD8αβ+ IELs are indicated. Six independent experiments (DQ8-Dd-IL-15tg sham, n=11, gluten n=14; DQ8-villin-IL-15tg sham, n=20, gluten n=20; DQ8-Dd-villin-IL-15tg sham, n=17, gluten n=22); mean; ANOVA/ Tukey’s multiple comparison.
(B) Numbers of NKG2D+ NKG2− CD8+ IELs / 100 IECs. Six independent experiments (DQ8-Dd-IL-15tg sham, n=11, gluten n=13; DQ8-villin-IL-15tg sham, n=20, gluten n=20; DQ8-Dd-villin-IL-15tg sham, n=16, gluten n=19); mean; ANOVA / Tukey’s multiple comparison.
(C) Percentage of CD94+ NKG2A− CD8αβ+ IELs are indicated. Three independent experiments (DQ8-Dd-IL-15tg sham, n=10, gluten n=10; DQ8-villin-IL-15tg sham, n=11, gluten n=11; DQ8-Dd-villin-IL-15tg sham, n=9, gluten n=10); mean; ANOVA / Tukey’s multiple comparison.
(D) Numbers of CD94+NKG2A− CD8+ IELs / 100 IECs. Three independent experiments (DQ8-Dd-IL-15tg sham, n=10, gluten n=10; DQ8-villin-IL-15tg sham, n=11, gluten n=11; DQ8-Dd-villin-IL-15tg sham, n=9, gluten n=10); mean; ANOVA / Tukey’s multiple comparison.
(E) Intracellular granzyme B+ IELs are indicated by percentage. Data are representative of five independent experiments shown as mean (DQ8-Dd-IL-15tg sham, n=9, gluten n=10; DQ8-villin-IL-15tg sham, n=14, gluten n=13; DQ8-Dd-villin-IL-15tg sham, n=12, gluten n=18). ANOVA / Tukey’s multiple comparison.
(F) Numbers of granzyme B+ IELs / 100 IECs. Five independent experiments (DQ8-Dd-IL-15tg sham, n=11, gluten n=13; DQ8-villin-IL-15tg sham, n=20, gluten n=20; DQ8-Dd-villin-IL-15tg sham, n=16, gluten n=19); mean; ANOVA / Tukey’s multiple comparison.
(G) Intracellular granzyme B mean fluorescence intensity (MFI) was measured. Four independent experiments (DQ8-Dd-IL-15tg sham, n=9, gluten n=9; DQ8-villin-IL-15tg sham, n=14, gluten n=13; DQ8-Dd-villin-IL-15tg sham, n=10, gluten n=15); mean; ANOVA / Tukey’s multiple comparison.
(H) The percentages of CD8αβ+ CD107a+ IELs are indicated.
(I) Numbers of CD8+ CD107a+ IELs / 100 IECs are shown. Two independent experiments (DQ8-Dd-IL-15tg sham, n=7, gluten n=6; DQ8-Dd-villin-IL-15tg sham, n=8, gluten n=5; DQ8-Dd-villin-IL-15tg sham, n=5, gluten n=4). ANOVA / Tukey’s multiple comparison.
(J) Expression of Prf1 in the intestinal epithelium was measured by qPCR. Relative expression levels in sham and gluten-fed mice for each strain are shown (DQ8-Dd-IL-15tg sham, n=16, gluten n=16; DQ8-villin-IL-15tg sham, n=15, gluten n=15; DQ8-Dd-villin-IL-15tg sham, n=20, gluten n=26). Unpaired, two-tailed, t-test.

