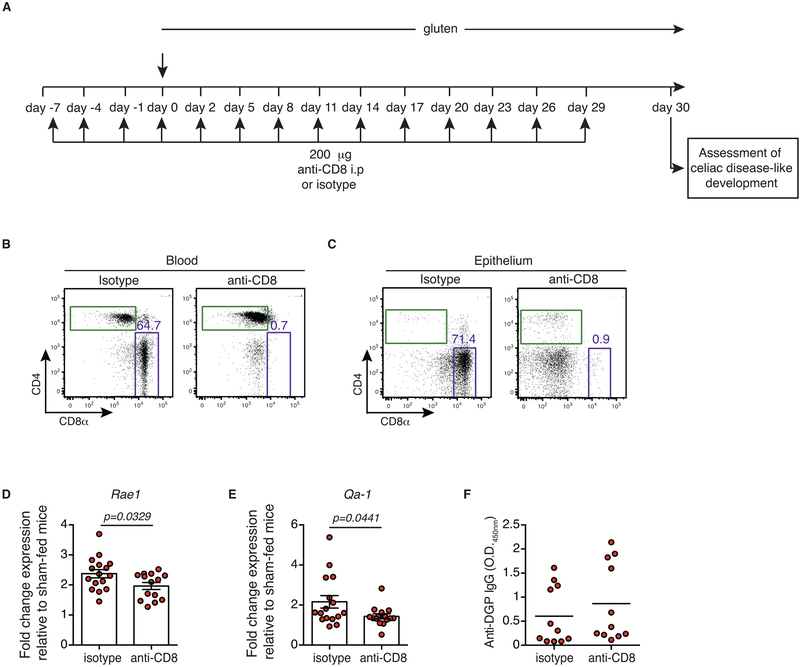
Extended Data Figure 5. Impact of CD8 T cell depletion on antibody production and epithelial stress markers.
(A-F) Ten-week old DQ8-Dd-villin-IL-15tg mice were treated with 200 or 400 μg of depleting anti-CD8α antibody (clone 2.43) or its isotype control (rat IgG2b) twice prior to and during the course of gluten feeding.
(A) Experimental scheme.
(B, C) Representative dot-plots showing depletion efficiency in the (B) blood and (C) epithelium of DQ8-Dd-villin-IL-15tg mice after 30 days of anti-CD8α treatment.
(D, E) Rae1 (D) and Qa-1 (E) gene expression in the intestinal epithelium was determined by qPCR. Relative expression levels were normalized against the expression levels observed in sham-fed DQ8-Dd-villin-IL-15tg mice. Four independent experiments (gluten + isotype, n=16; gluten + anti-CD8, n=14). mean ± s.e.m; Unpaired, two-tailed, t-test.
(F) Anti-deamidated gluten peptide (DGP) IgG levels from serum collected thirty days after gluten feeding. Data are representative of three independent experiments shown as mean (gluten + isotype, n=11; gluten + anti-CD8, n=11).

