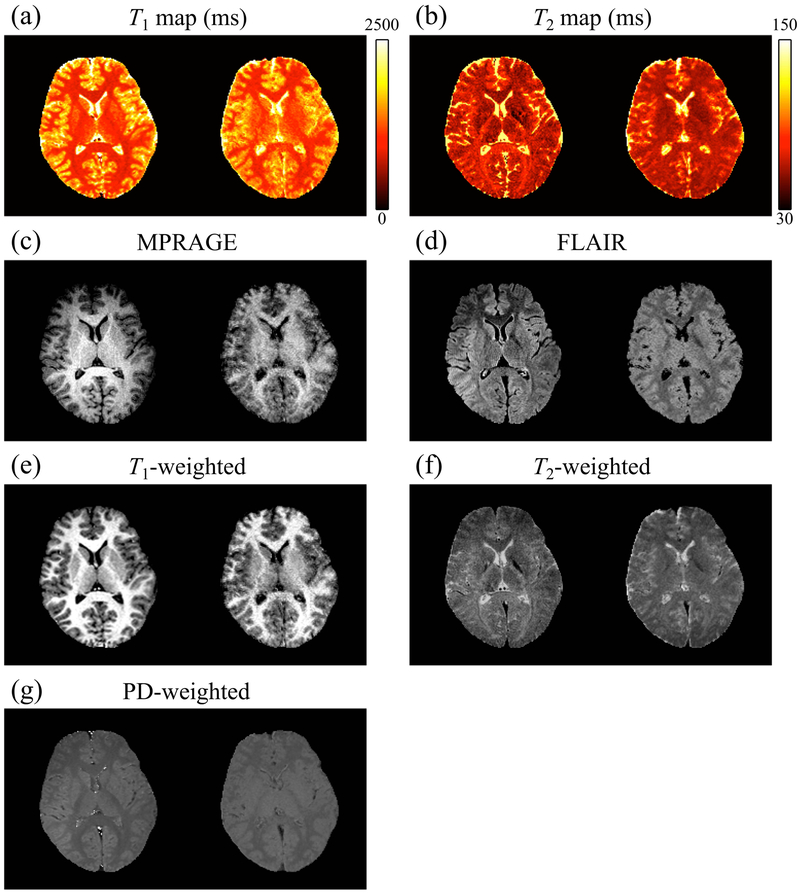
Fig. 8:
A side-by-side comparison of reference (left) and NN-predicted values (right) is shown for one representative subject (volunteer 3). Results were qualitatively similar for other subjects, and data from all subjects were included in the quantitative evaluation presented in Fig. 9 and in Supporting Information Figure S1. While reference results were available only over the 2D slice shown here, the predicted results were available over the whole brain as visually emphasized in Fig. 7.

