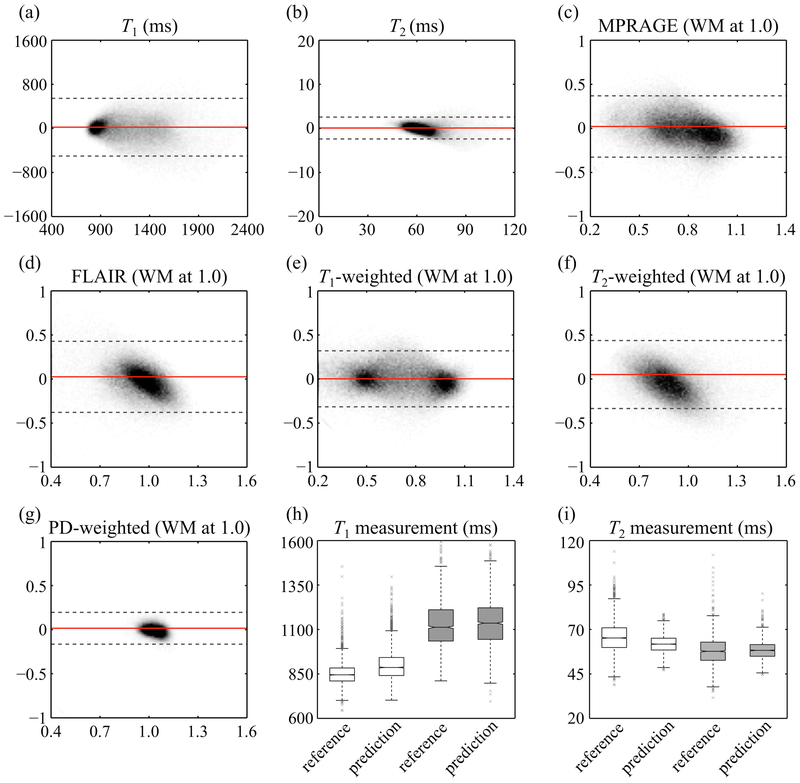
Fig. 9:
Reference and predicted results were compared, for each one of the predicted signal types (T1, T2, MPRAGE, FLAIR, T1-, T2-, and PD-weighted). Each plot, similar to a Bland-Altman analysis, combines results from all volunteers. Plots in (c-g) were normalized by defining ‘1.0’ as the signal level of white matter. Gray dashed lines represent the 95% limits of agreement, and solid red lines show the bias. Quantitative T1 (h) and T2 (i) values were further compared, for reference and predicted results, based on white matter (white boxes) and thalamus (gray boxes) ROIs. The plots in (h,i) combine data from all 8 subjects. Outliers are shown with gray ‘×’ markers.

