
Figure 3. Main determinants of current and particle densities.
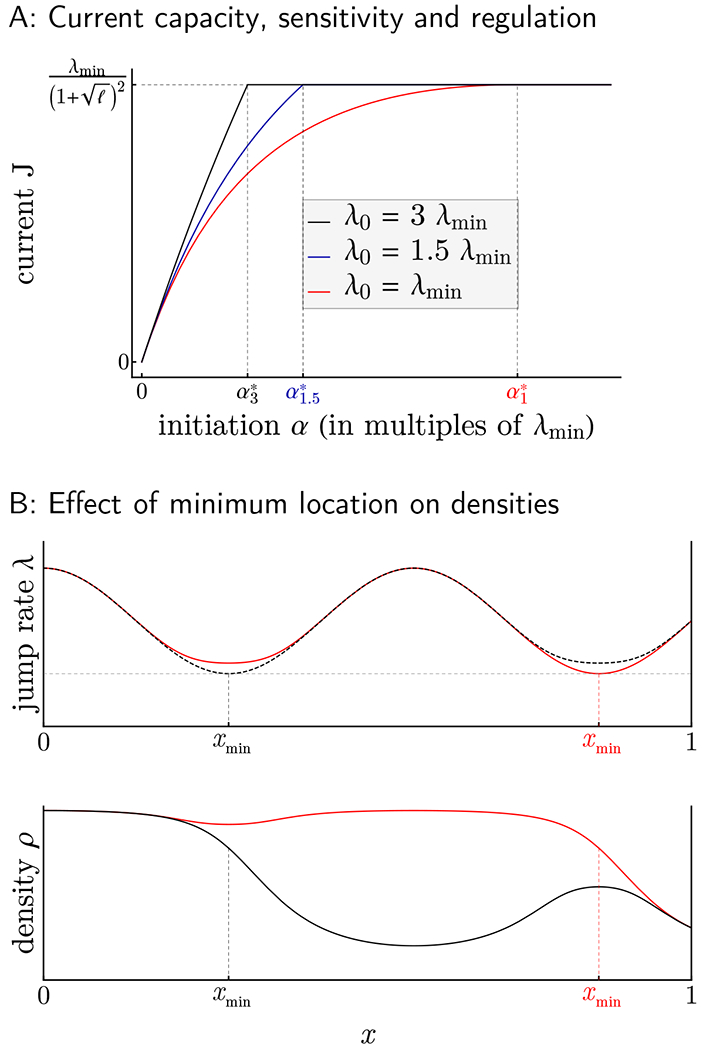
A: We plot the current J in LD and MC against the initiation rate α, for various choices of λ0. While λmin governs the maximum current at which J reaches a plateau (coinciding with the transition from LD to MC), changing the size of λ0 results in changes in ∂αJ, the sensitivity of J with respect to α. Distinct configurations of λmin and λ0 give rise to vastly different dependencies of J on α, suggesting different responses to global changes in the ribosome pool. , , and correspond to the α* value (in units of λmin) when λ0 = 3λmin, λ0 = 1.5λmin, and λ0 = λmin, respectively. B: Two elongation rate profiles that differ slightly in overall shape, but drastically in their position xmin of minimum elongation are plotted (top panel) together with their associated MC ribosome densities (bottom panel). The branch switching phenomenon has extreme consequences for equilibrium particle densities and hence ribosomal costs, with elongation rate profiles achieving minimum rates close to the initiation site (top, dotted black curve) benefiting from drastic savings (bottom, black curve) compared to otherwise similar profiles (red curves).