
Figure 4. Estimated Depression Scores as a Function of Treatment and the Left Ventral Striatal (VS) Reward Expectancy (RE) Sub-index.
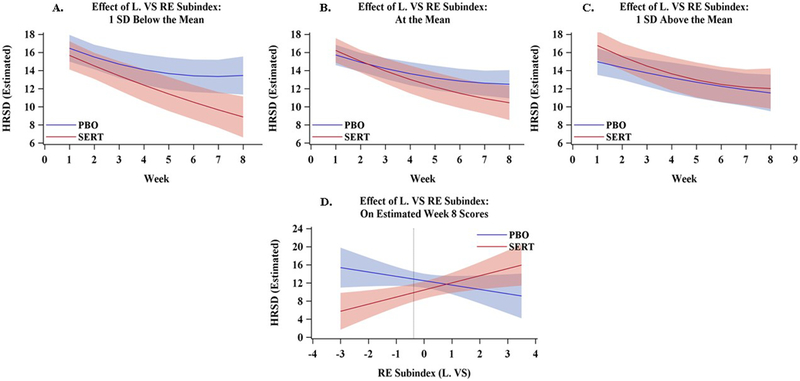
Dark lines represent estimated Hamilton Rating Scale for Depression (HRSD) scores and cones represent 95% confidence intervals. Values were estimated from the primary multilevel statistical model at three levels of the left RE sub-index, 1 SD below the mean (Panel A), the mean (Panel B), and 1 SD above the mean (Panel C). Panel D depicts the estimated HRSD scores at Week-8 (y-axis) from across the full range of left RE sub-index scores in the sample (x-axis). The dotted vertical line represents the point below which the sertraline (SERT) and placebo (PBO) difference crosses the NICE threshold for a clinically significant difference (HRSD ≥ 3 points).