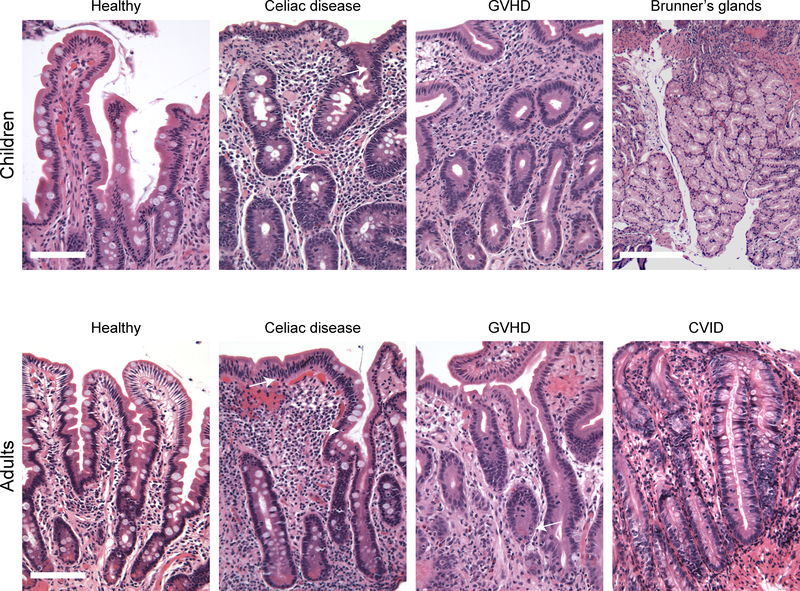
Figure 1: Duodenal biopsy histology.
Representative H&E images for each subject group are shown. White arrows indicate intraepithelial lymphocytes in CD biopsies and apoptotic crypt epithelial cells in GVHD. Note the absence of plasma cells in CVID. Scale: bar = 100 μm; Brunner’s gland scale bar = 250 μm.

