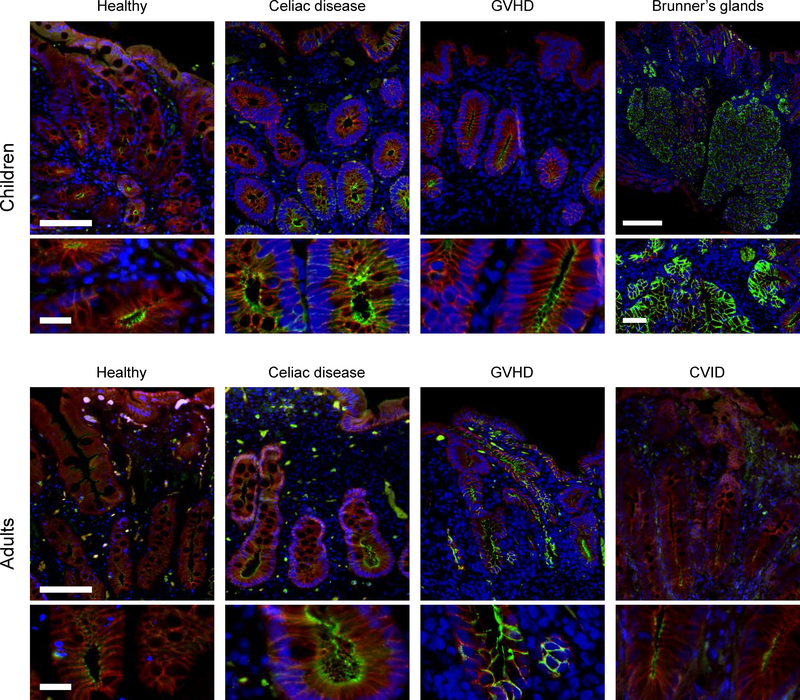
Figure 2: Claudin-2 expression.
Representative claudin-2 immunofluorescence images for each subject group are shown. Immunofluorescence shows claudin-2 (green), E-cadherin (red), and DNA (blue). Note the intense claudin-2 expression within Brunner’s gland epithelia. Scale bar = 100 μm; inset bar = 20 μm. Brunner’s gland scale: bar = 250 μm; inset bar = 50 μm.

