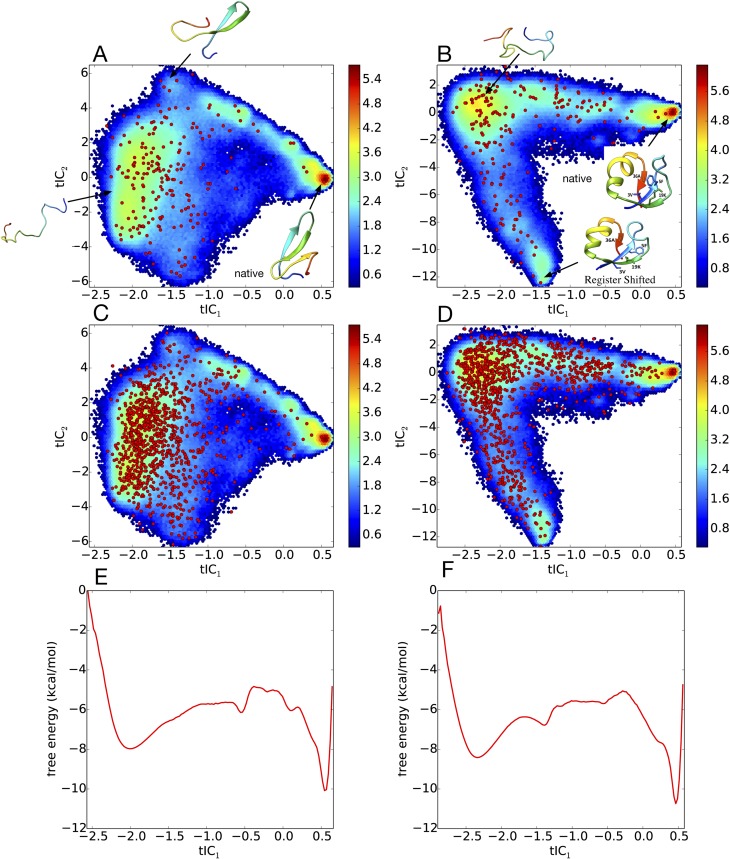
FIG. 5.
200-state MSMs of (a) GTT WW domain and (b) K12M NTL9(1–39), built from ultralong folding trajectory data, are shown projected onto the two largest tICA components. Red circles show the locations of the MSM microstates. The heat map shows a density plot of the raw trajectory data, with color bar values denoting the natural logarithm of histogram counts. 1000-state MSMs are shown for (c) GTT WW domain and (d) K12M NTL9(1–39). (e) and (f) Corresponding 1-D free energy profiles along the first tICA component, calculated from histogramming the trajectory data in bins of width 0.025.

